


Anyone documenting complex infrastructures quickly hits the limits of static diagrams and MS PowerPoint as tools. A setup consisting of multiple machines, two different LANs and a handful of Docker containers can certainly be described in text with many sentences – but an animated diagram that actually shows the data flow is much faster for us humans to grasp. I wanted exactly that kind of solution: one that generates an animated architecture diagram from text. I want to be able to open the diagram directly in the browser, embed it in WordPress and also export it in different formats for LinkedIn & Co, not just SVG.
The long-term goal is a small web interface through which I can generate diagrams via an LLM chat dialog. The idea is that I describe my setup in natural language, the model generates the D2 code, and the result is displayed directly in my browser. The web interface will come in the second part of this short series. In this first post I am building the local rendering pipeline: from the D2 description through the animated SVG to the exported GIF.
Why D2?
There are many diagram tools, but most of them fail to meet at least one of my requirements: either they are cloud-dependent, not scriptable, or they only produce static output. D2 meets all my requirements:
- Open Source (Mozilla Public License 2.0)
- Purely text-based and therefore ideal for LLMs, no GUI, no cloud, no dependencies after installation
- Native animated edges with
style.animated: true - Automatic layout via dagre or ELK, which means I do not have to specify any pixel coordinates
- Runs entirely locally, making it ideal as a backend for a locally hosted LLM-driven generator
The last point is the crucial one: because D2 is text-based, a local language model can generate the diagram code. The model only needs to master a simple declarative syntax rather than doing pixel arithmetic. However, the LLM used should be capable of deriving a diagram from a prose but technical description.
Installation on Ubuntu
D2 is delivered as a standalone binary. The official install script downloads the appropriate release from GitHub and installs it to ~/.local/bin/:
Command: curl -fsSL https://d2lang.com/install.sh | sh -s --
You can use the following command to check whether the installation worked.
Command: ~/.local/bin/d2 version
Anyone who does not want to run the script blindly can inspect it first using --dry-run:
curl -fsSL https://d2lang.com/install.sh | sh -s -- --dry-runImportant: D2 lands in ~/.local/bin/, not in /usr/local/bin/. Always use the full path ~/.local/bin/d2 in scripts and agent skills, because systemd services often do not have ~/.local/bin/ in their PATH variable.
D2 Syntax: The First Diagram
The syntax of D2 is quickly learned. Nodes are simply declared, containers (e.g. for LAN zones) are nested using curly braces, and connections are defined with -> or <-> – the direction is visible from the angle brackets. Animation is activated per edge with style.animated: true.
Here is my current setup as an example. It covers three machines, two LANs and my local services:
direction: down

telegram: "Telegram\nControl channel" {
  style.fill: "#f0f0f0"
  style.stroke: "#aaaaaa"
}

lanA: LAN 192.168.178.x {
  optiplex: "Dell OptiPlex 5040\nNemoClaw + OpenShell egress\n192.168.178.142"
  windows: "Windows workstation\n192.168.178.96" {
    style.fill: "#f0f0f0"
  }
}

lanB: LAN 192.168.2.x {
  firecrawl: "Firecrawl  (A6000 Ada)\n5 containers  ·  port :3002\n192.168.2.119"
  ollama: "Ollama server  (A6000)\nqwen3.6:27b  +  qwen3-embedding:4b\n192.168.2.57:11434" {
    shape: cylinder
  }
  hermes: "Hermes Agent\nTelegram gateway\n192.168.2.119"
}

web: "The open web\nScrape targets" {
  style.fill: "#f0f0f0"
  style.stroke: "#aaaaaa"
}

telegram <-> lanB.hermes: "Tasks · Replies" {
  style.animated: true
}
lanA.windows -> lanA.optiplex: "SSH -L 18789 tunnel" {
  style.animated: true
  style.stroke-dash: 5
}
lanA.optiplex <-> lanB.firecrawl: "Scrape · :3002" {
  style.animated: true
}
lanB.firecrawl <-> lanB.ollama: "/v1  ·  LLM + embeddings" {
  style.animated: true
}
lanB.hermes <-> lanB.firecrawl: "Scrape request" {
  style.animated: true
}
lanB.hermes <-> lanB.ollama: "LLM inference" {
  style.animated: true
}
lanB.firecrawl <-> web: "Fetch pages" {
  style.animated: true
}
Containers like lanA and lanB are automatically created by D2 as visual zones. D2 calculates the layout itself – I only specify the logical structure.
If you now want to create a diagram yourself, save the example D2 syntax in a text file called e.g. diagram.d2. This file containing the diagram description then needs to be passed to D2 to generate the SVG file.
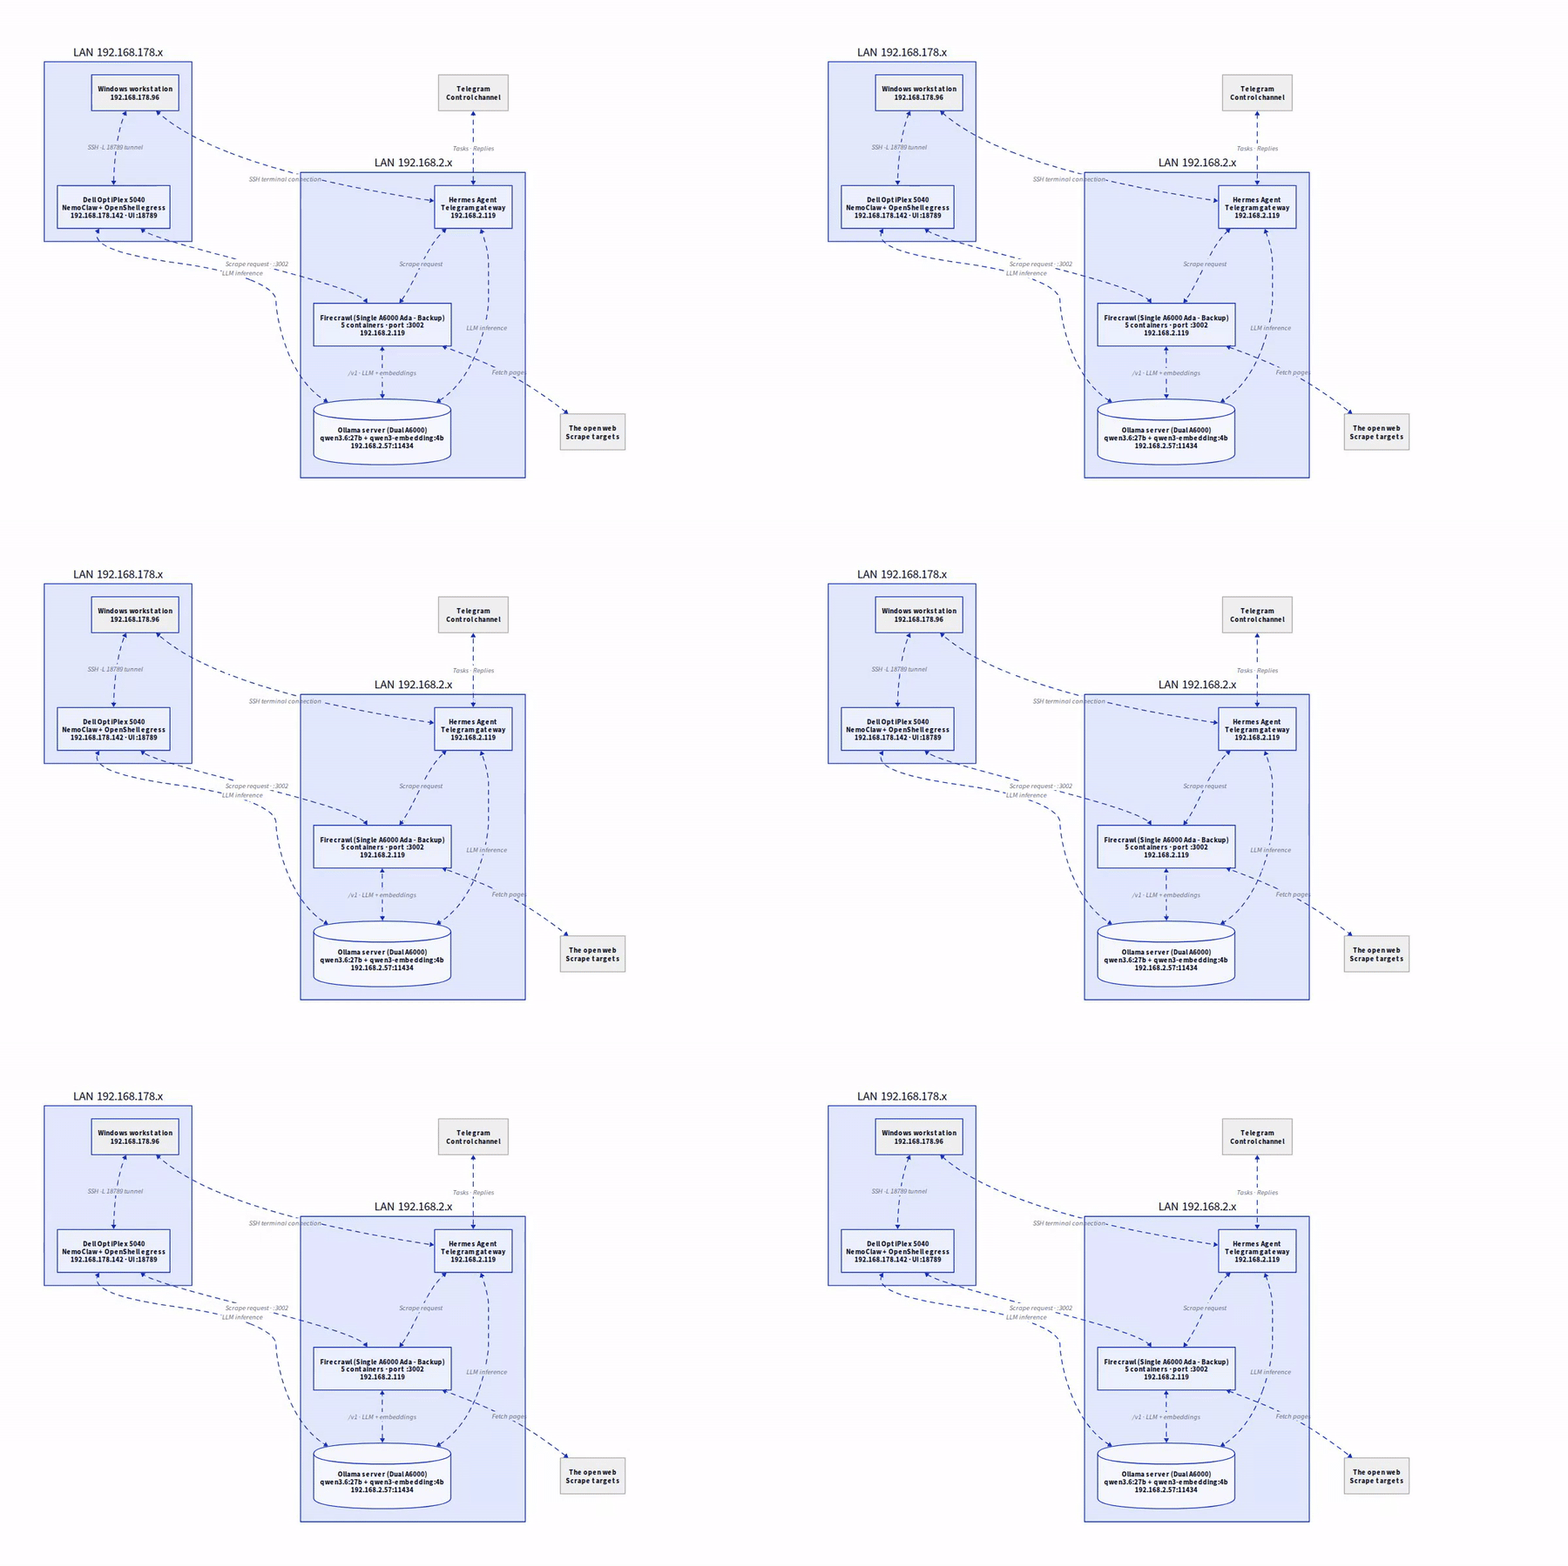
local ai stack – firecrawl hermes agent
Rendering SVG and Viewing it in the Browser
A single command is enough to generate the animated SVG from the diagram.d2 file:
Command: ~/.local/bin/d2 diagram.d2 diagram.svg
Anyone who wants to see the diagram live during editing can use watch mode. It starts a local server and automatically reloads the browser every time you save. In my case this unfortunately does not work, as I have no monitor connected to the machine and only work remotely via a terminal window.
Command: ~/.local/bin/d2 --watch diagram.d2 diagram.svg
The SVG can be embedded directly in WordPress as you can see here. The animation runs in the reader’s browser without any additional plugins or JavaScript.
Recording an Animated SVG as MP4
For platforms that cannot render SVG, a video is needed. I use Playwright with Headless Chromium for this: the browser loads the SVG and records the animation. Playwright stores the recording internally as WebM in a temporary folder, since WebM is Playwright’s native recording format. The record.js script immediately picks up this intermediate file and converts it in a single pass using ffmpeg. The only file that ends up in the working directory is the finished output.mp4. The WebM file is therefore just an internal intermediate step that I do not keep.
Installing Prerequisites
If you have not yet installed ffmpeg, you can do so with the following command on Ubuntu.
Command: sudo apt install -y ffmpeg
Now we create a folder in which we will save the animation from the SVG file as e.g. an MP4 file. This is also where our record.js script will live.
Command: mkdir ~/d2/recorder && cd ~/d2/recorder
Command: npm init -y
Command: npm install playwright
Command: npx playwright install --with-deps chromium
You have now installed the individual components needed to convert the SVG animation into e.g. an MP4 format.
The record.js Pipeline
The last missing piece is the pipeline that creates the video from the SVG file. Create a JavaScript file named record.js in the ~/d2/recorder subfolder we created above – the same folder where the diagram.svg and diagram.d2 files are located.
Copy the following content into this record.js file.
const { chromium } = require('playwright');
const path = require('path');
const fs = require('fs');
const { execSync } = require('child_process');

(async () => {
  const svgPath = path.resolve(process.argv[2] || '../diagram.svg');
  const outFile  = process.argv[3] || 'output.mp4';
  const SECONDS  = 6;
  const W = 1200, H = 800;

  fs.mkdirSync('_videos', { recursive: true });

  const browser = await chromium.launch();
  const ctx = await browser.newContext({
    viewport: { width: W, height: H },
    recordVideo: { dir: '_videos/', size: { width: W, height: H } }
  });

  const page = await ctx.newPage();
  await page.goto('file://' + svgPath);
  await page.waitForTimeout(SECONDS * 1000);
  await ctx.close();
  await browser.close();

  const webm = '_videos/' + fs.readdirSync('_videos/').find(f => f.endsWith('.webm'));
  execSync(
    `ffmpeg -y -i ${webm} ` +
    `-vf "scale=trunc(iw/2)*2:trunc(ih/2)*2" ` +
    `-c:v libx264 -movflags +faststart -pix_fmt yuv420p ${outFile}`
  );

  console.log('Done:', outFile);
})();
It is important that you take a close look at the script and familiarise yourself with the variables, as this is where you can control the recording length and resolution.
Running the Script
Once the record.js file has been saved and a diagram.svg file already exists, you can run the pipeline.
node record.js ../diagram.svg output.mp4The result is an *.mp4 file in the current directory.
Converting MP4 to an Animated GIF
LinkedIn comments do not accept MP4 but do support many other formats such as GIF. An animated GIF is also often more practical than a video on other platforms. The conversion takes place in two steps: first generate an optimised colour palette, then render the GIF using it.
Step 1: Generate colour palette
Command: ffmpeg -i output.mp4 -vf "fps=15,scale=900:-1:flags=lanczos,palettegen" palette.png
Step 2: Render GIF using palette
Command: ffmpeg -i output.mp4 -i palette.png -filter_complex "fps=15,scale=900:-1:flags=lanczos[x];[x][1:v]paletteuse" output.gif
Important: Step 2 requires -filter_complex instead of -vf, because two input files are being processed. Using -vf causes ffmpeg to abort with an error.
The result is a GIF of around 3–4 MB at 900 pixels wide and 15 fps. That is small enough for LinkedIn comments and sharp enough for the blog.
What Comes Next
The pipeline is in place: D2 generates an animated SVG from a text-based description, Playwright records it as MP4, and ffmpeg exports it as a GIF. Every step runs entirely locally – no cloud service, no external API.
In the next post I will build the web interface around it: an LLM chat dialog in which I describe my setup in natural language, the local model generates the D2 code from it, and the finished diagram appears directly in the browser. Export buttons for SVG, MP4 and GIF will be included.





The tutorial offers a clear and practical guide for setting up and running the Tensorflow Object Detection Training Suite. Could…
This works using an very old laptop with old GPU >>> print(torch.cuda.is_available()) True >>> print(torch.version.cuda) 12.6 >>> print(torch.cuda.device_count()) 1 >>>…
Hello Valentin, I will not share anything related to my work on detecting mines or UXO's. Best regards, Maker
Hello, We are a group of students at ESILV working on a project that aim to prove the availability of…