

If, like me, you run your models locally and sovereignly, you know the problem: I want to know how fast a model really is on my hardware and not as a theoretical figure, but the way it actually reaches me as an end user. For exactly that, the llama.cpp world has the popular tool llama-bench. The catch: it works exclusively with llama.cpp. The moment I bring vLLM, SGLang or any other inference server into play, I’m left without a comparable tool.
In this post I introduce you to llama-benchy. It’s a tool that closes exactly this gap: the great thing is that I now get measurements at different context depths, but for any OpenAI-compatible endpoint. No matter whether you run Ollama, vLLM or llama.cpp.
You’ll find llama-benchy here on GitHub: https://github.com/eugr/llama-benchy
Why the existing tools fall short
Before we get started, it’s worth a look at the underlying motivation, because it explains very well what llama-benchy does better.
llama-bench is great, but it has two limitations: it’s tied to llama.cpp, and it measures directly through the C++ engine. That measurement is therefore not necessarily representative of what you, as a user, actually experience through the API.
vLLM does ship its own powerful benchmarking tool that also runs against other engines, but there are pitfalls in the details (source: https://github.com/eugr/llama-benchy#motivation):
- Measuring prompt-processing speeds cleanly at different context lengths is tricky to impossible.
vllm bench sweep serverepeats the same prompt across multiple runs, which hits the prefix cache directly in llama-server. The result: unrealistically low TTFT values and absurdly high prompt-processing speeds. - The TTFT measurement doesn’t measure the time to the first usable token, but to the very first data chunk from the server – and in
/v1/chat/completionsmode that chunk often doesn’t contain any generated token yet. - Only the random dataset allows a freely chosen token count. But a randomly generated token sequence can’t be meaningfully used for Speculative Decoding or MTP (Multi-Token Prediction).
The author of llama-benchy writes that in early January 2026 he simply couldn’t find any tool delivering llama-bench-style measurements at different context depths for arbitrary OpenAI-compatible endpoints. So he built it himself.
What llama-benchy can do
The feature list is tailored exactly to the weaknesses above:
- Measures Prompt Processing (pp) and Token Generation (tg) at different context depths.
- Optionally separates pre-filling the context from the actual prompt processing over already-cached context (prefix-caching measurement).
- Reports TTFR (Time To First Response), est_ppt (estimated prompt-processing time) and e2e_ttft (End-to-End Time To First Token).
- Configurable prompt length (
--pp), generation length (--tg) and context depth (--depth). - Multiple runs (
--runs) with mean ± standard deviation. - Uses HuggingFace tokenizers for accurate token counts.
- Handles MTP chunks correctly.
- Downloads a book from Project Gutenberg as the source text, so that spec-decoding/MTP models are measured realistically (default: Sherlock Holmes).
- Supports concurrent requests (
--concurrency) to measure throughput under load. - Saves results as Markdown, JSON or CSV.
- Auto-detects the HuggingFace model name via the
/modelsendpoint when--modelisn’t set.
One current limitation you should know: it measures exclusively against the /v1/chat/completions endpoint.
Installation with uv
Installation via uv is recommended. The nice part: you don’t have to install anything permanently. With uvx you launch the release version straight from PyPI:
Command: uvx llama-benchy --base-url <ENDPOINT_URL> --model <MODEL_NAME>
If you’d rather test the current version from the main branch, the command looks like this:
Command: uvx --from git+https://github.com/eugr/llama-benchy llama-benchy --base-url <ENDPOINT_URL> --model <MODEL_NAME>
Alternatively, you can of course install the tool the classic way into a virtual environment (uv venv + uv pip install -e .) or system-wide (uv pip install -U llama-benchy).
The first measurement
Once you’ve set up llama-benchy, here’s a typical call against a local endpoint:
Command: llama-benchy --base-url http://spark:8888/v1 --model openai/gpt-oss-120b --depth 0 4096 8192 16384 32768 --latency-mode generation
Out comes a table in the familiar llama-bench look. For each context depth it gives one pp and one tg row, including the standard deviation. Exactly what I need for a serious comparison: I see at a glance how prefill and decode speed drop off as the context grows.
My tip from the README, which I can only underline: use the “generation” latency mode. It gets the prompt-processing values closest to the real numbers. This is especially true for shorter prompts.
Running llama-benchy with Ollama
I like to run my models locally with Ollama, and that can be benchmarked with no trouble at all. Ollama exposes an OpenAI-compatible endpoint at /v1. So you simply pass the address of your Ollama server as the base URL. If Ollama runs locally, that’s http://localhost:11434/v1; in my case the inference runs on a dedicated machine, so the base URL is e.g. http://192.168.2.57:11434/v1.
Command: uvx llama-benchy --base-url http://localhost:11434/v1 --model qwen3.6:27b --tokenizer Qwen/Qwen3.6-27B --depth 0 4096 8192 --latency-mode generation
The crucial pitfall: by default the --tokenizer parameter falls back to the value of --model. With Ollama, though, --model is the Ollama tag (e.g. qwen3.6:27b) and that is not a valid HuggingFace tokenizer name. llama-benchy would then try to load an HF repo with exactly that name and fail. That’s why, for Ollama models, you must always set --tokenizer explicitly to the matching HF repo so the token counting is correct.
Good to know: the tokenizer is identical across all quantizations of a model. Whether you run BF16, FP8 or a GGUF quantization makes no difference to the tokenizer. All you have to do is always point to the vendor’s official base repo.
For my four currently most-used models, the matching tokenizer IDs look like this:
| Ollama tag | HF tokenizer ID (for --tokenizer) |
|---|---|
nemotron3:33b-bf16 |
nvidia/Nemotron-3-Nano-Omni-30B-A3B-Reasoning-BF16 |
qwen3.6:27b |
Qwen/Qwen3.6-27B |
qwen3.6:35b-a3b-bf16 |
Qwen/Qwen3.6-35B-A3B |
nemotron3:33b |
nvidia/Nemotron-3-Nano-Omni-30B-A3B-Reasoning-BF16 |
As you can see, nemotron3:33b and nemotron3:33b-bf16 point to the same HF repo – it’s the same model (NVIDIA Nemotron 3 Nano Omni), just once as Q4_K_M and once as BF16. That’s exactly the point mentioned above: quantization doesn’t change the tokenizer.
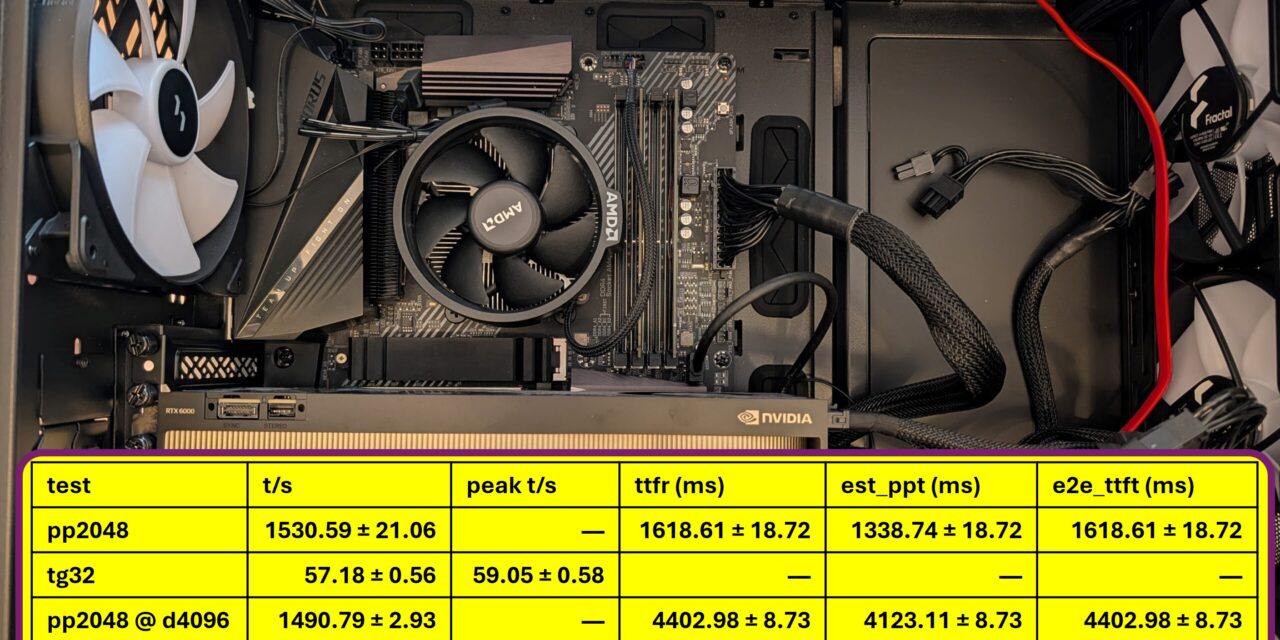
My result on two NVIDIA RTX A6000
I ran the benchmark on my inference server with two NVIDIA RTX A6000. The model qwen3.6:35b-a3b-bf16 is unquantized, in BF16.
Command: uvx llama-benchy --base-url http://192.168.2.57:11434/v1 --model qwen3.6:35b-a3b-bf16 --tokenizer Qwen/Qwen3.6-35B-A3B --depth 0 4096 8192 --latency-mode generation
| test | t/s | peak t/s | ttfr (ms) | est_ppt (ms) | e2e_ttft (ms) |
|---|---|---|---|---|---|
| pp2048 | 1530.59 ± 21.06 | — | 1618.61 ± 18.72 | 1338.74 ± 18.72 | 1618.61 ± 18.72 |
| tg32 | 57.18 ± 0.56 | 59.05 ± 0.58 | — | — | — |
| pp2048 @ d4096 | 1490.79 ± 2.93 | — | 4402.98 ± 8.73 | 4123.11 ± 8.73 | 4402.98 ± 8.73 |
| tg32 @ d4096 | 56.98 ± 0.43 | 58.85 ± 0.44 | — | — | — |
| pp2048 @ d8192 | 1469.24 ± 2.98 | — | 7249.49 ± 14.70 | 6969.62 ± 14.70 | 7249.49 ± 14.70 |
| tg32 @ d8192 | 56.96 ± 1.88 | 58.83 ± 1.94 | — | — | — |
llama-benchy 0.3.7 · 2026-06-08 · latency mode: generation
My verdict: what are these numbers good for?
For interactive single-user use, this is a thoroughly solid result. Around 57 tokens/s in decode is well above my reading speed. So the response feels fluid, almost like real-time typing. I especially like that the decode rate stays nearly constant across all context depths: whether 0 or 8k context, I always land at ~57 t/s. That makes the behavior nicely predictable.
The honest weak spot is the time to the first token with long context. Prefill runs at a stable ~1,500 t/s, but with 8k context that means about 7 seconds of waiting before anything comes back at all. For a chat with short prompts that’s irrelevant; for a RAG setup with large context windows it’s noticeable.
I see two levers for more speed: first, the model runs here unquantized in BF16. Since the A6000 (Ampere) has no FP8 in hardware, a Q4/Q5 or AWQ quantization would be the obvious lever. It would speed up decode considerably and free up VRAM. Exactly that kind of comparison is quickly done with llama-benchy. Second, Ollama spreads the model across both cards as a layer split; an engine with true tensor parallelism (e.g. vLLM) could lift both prefill and decode here.
My verdict: for my sovereign homelab use with a single user and the model in full BF16 quality, this is absolutely usable. Anyone optimizing for throughput under load or fast responses with huge contexts should benchmark quantization and a different inference engine – and that’s exactly what llama-benchy is for.
And now under load: four parallel clients
It gets interesting when several requests hit the Ollama server at the same time. With --concurrency 4, llama-benchy fires off four clients in parallel. The table then gains two throughput columns: t/s (total) for the aggregate throughput of all four combined, and t/s (req) for the average per individual request.
Command: uvx llama-benchy --base-url http://192.168.2.57:11434/v1 --model qwen3.6:35b-a3b-bf16 --tokenizer Qwen/Qwen3.6-35B-A3B --depth 0 4096 8192 --latency-mode generation --concurrency 4
| test | t/s (total) | t/s (req) | ttfr (ms) | est_ppt (ms) |
|---|---|---|---|---|
| pp2048 (c4) | 1116.50 ± 1.40 | 1561.19 ± 1738.91 | 4495.64 ± 2116.70 | 3289.39 ± 2116.70 |
| tg32 (c4) | 20.06 ± 0.06 | 61.72 ± 0.84 | — | — |
| pp2048 @ d4096 (c4) | 1333.33 ± 2.71 | 879.66 ± 605.50 | 11439.95 ± 5213.15 | 10233.70 ± 5213.15 |
| tg32 @ d4096 (c4) | 8.55 ± 0.02 | 59.96 ± 0.94 | — | — |
| pp2048 @ d8192 (c4) | 1379.59 ± 1.94 | 822.71 ± 518.98 | 18478.59 ± 8353.74 | 17272.34 ± 8353.74 |
| tg32 @ d8192 (c4) | 5.41 ± 0.01 | 60.01 ± 0.87 | — | — |
llama-benchy 0.3.7 · 2026-06-08 · latency mode: generation · peak t/s (req) ~62–64
My verdict on concurrency
At first glance, t/s (req) looks excellent: every single request still streams at around 60 tokens/s, virtually unchanged from single-user operation. The interesting value, though, is t/s (total) and it drops under load instead of rising: from ~20 t/s without context, through 8.5, down to 5.4 t/s at 8k. So four parallel users get fewer tokens per second in total than a single user (where it was 57 t/s).
The reason lies in the TTFT: it shoots up to as much as ~18 seconds at 8k context, and the enormous spread (±8.3 s) reveals that some requests are served immediately while others sit in the queue for a long time. That’s exactly how a server behaves when it processes parallel requests one after another instead of bundling them. Ollama, with its llama.cpp backend, is simply built for sovereign single-user use on your own hardware not as a multi-user serving engine.
My takeaway: for me as a single user in the homelab, everything is great. But anyone who wants to serve multiple users at the same time needs an engine with continuous batching like vLLM or SGLang. There, the four requests would share the compute step and the total throughput would be well above the single-user value. And that’s exactly the point: llama-benchy made this difference visible to me in a single run instead of just guessing, I now have the numbers.
How to find the right tokenizer ID
For your own models, the ID is quickly determined:
- Go to huggingface.co and search for the model name (e.g. “Qwen3.6 27B” or “Nemotron 3 Nano Omni”).
- Pick the vendor’s official base repo. You can recognize it by the organization in front:
nvidia/…,Qwen/…,openai/…orzai-org/…. Stay away from third-party GGUF or quant forks (such asunsloth/…orlmstudio-community/…); you want the canonical tokenizer repo. - In the “Files and versions” tab, check whether
tokenizer.jsonortokenizer_config.jsonare present. If so, the repo ID – i.e. theOrganization/Modelpart of the path – is exactly what you enter for--tokenizer.
A practical trick: in the vLLM and SGLang examples on the HF model cards, the canonical ID always appears as --model-path or --model. That’s exactly the string you need for --tokenizer. And on the model page at ollama.com the upstream source is often linked directly.
Understanding the metrics
So that the table doesn’t just look pretty but you can actually interpret it, here are the most important columns. All times are in milliseconds.
t/s (tokens per second) means something different depending on the row:
- For Prompt Processing:
total prompt tokens / est_ppt– i.e. the prefill speed. - For Token Generation:
(generated tokens - 1) / (time of last token - time of first token)– the pure decode speed, excluding the latency of the first token.
peak t/s exists only for token generation: the highest throughput measured in any 1-second window during the run.
ttfr (Time To First Response) is the raw time until the client receives any stream data from the server. That can also be empty chunks or role definitions. This number includes the network latency. It’s exactly the measurement method that vllm bench serve also reports as TTFT.
est_ppt (Estimated Prompt Processing Time) is calculated as TTFR - estimated latency and thereby estimates the pure server-side processing time of the prompt.
e2e_ttft (End-to-End Time To First Token) is time of the first content token - start time. So the total time I, as a user, perceive from sending the request to the first visible generated token.
The latency mechanism behind it is interesting. Via --latency-mode the tool estimates the latency and subtracts it from ttfr to arrive at est_ppt:
- api (default): time to fetch
/models– eliminates only the network latency. - generation: time to generate exactly 1 token – tries to factor out network and server overhead.
- none: latency is assumed to be 0.
Measuring prefix caching realistically
This gets interesting for everyone who works with long, recurring context. That can be the case with system prompts or RAG, for example. With --enable-prefix-caching (and --depth > 0), llama-benchy runs a two-stage process per run:
- Context Load: the context is sent as a system message with an empty user message. The server has to process and cache it. Reported as
ctx_pp @ d{depth}. - Inference: the same context plus the actual prompt as a user message. Now the server should reuse the cached context. Reported as
pp{tokens} @ d{depth}.
This is exactly how I see how fast a follow-up prompt really runs with an already pre-filled context and that’s exactly the number that matters in everyday use.
Command: llama-benchy --base-url http://spark:8888/v1 --model openai/gpt-oss-120b --depth 0 4096 8192 16384 32768 --latency-mode generation --enable-prefix-caching
A note from the README: normally you don’t have to disable prompt caching on the server, because the probability of cache hits is low. If you do get hits, --no-cache adds some noise and additionally sends cache-prompt=false to the server.
Throughput under load: concurrency
Anyone running a server for multiple parallel users wants to know the saturation point. With --concurrency 1 2 4, llama-benchy launches several parallel clients and adds two columns to the table:
- t/s (total): the aggregate throughput of all clients combined.
- t/s (req): the average throughput per client.
This way you find exactly the point at which more clients no longer increase the total throughput. That’s extremely handy for correctly gauging your own hardware.
By the way, --depth, --pp, --tg and --concurrency can be combined freely. The benchmarks then run over all combinations in the hierarchy depth → pp → tg → concurrency.
Further processing of the results
For your own analysis or visualizations, you export the data as JSON or CSV. --format json delivers the most detailed data, and with --save-total-throughput-timeseries you even get the total throughput written into the JSON in 1-second intervals. With that, the course of a run can be plotted cleanly.
Conclusion
llama-benchy is exactly the tool I’d been missing in my homelab. I can finally compare my locally running models with the same familiar llama-bench metrics. The great thing on top of that is that I’m independent of whichever inference engine works behind the API endpoint. The fact that the tool deliberately addresses the weaknesses of existing benchmarks (real TTFT to the first usable token, clean prefix caching, a realistic text source for MTP) makes it credible to me.
For me it fits perfectly into the idea of sovereign AI: I measure on my own hardware, with my own models, using a lean open-source tool that launches via uvx without any installation ballast. If you run local LLM endpoints and finally want solid numbers instead of gut feeling, I can clearly recommend llama-benchy.
You’ll find the project on GitHub: github.com/eugr/llama-benchy
The tutorial offers a clear and practical guide for setting up and running the Tensorflow Object Detection Training Suite. Could…
This works using an very old laptop with old GPU >>> print(torch.cuda.is_available()) True >>> print(torch.version.cuda) 12.6 >>> print(torch.cuda.device_count()) 1 >>>…
Hello Valentin, I will not share anything related to my work on detecting mines or UXO's. Best regards, Maker
Hello, We are a group of students at ESILV working on a project that aim to prove the availability of…