

Agent orchestration is conceptually exactly the leap that turns “LLM inference” into actual “intelligent applications”. I already have a working NAT setup with Ollama in place, as described in my blog post here “NeMo Agent Toolkit on the RTX A6000 Ada – from the inference layer to the orchestrator layer“. Now I want to describe the approach and the architecture step by step, from the basics all the way to complex multi-agent patterns.
What does “orchestration” actually mean?
In the context of the NeMo Agent Toolkit and related approaches, orchestration refers to the coordination of multiple components into meaningful overall work. These components can be:
- Tools (functions that the agent calls, e.g.
wikipedia_searchor theDate_Timefunction) - LLMs (different models for different tasks, depending on their capabilities)
- Agents (self-contained ReAct loops that can themselves serve as “tools” for higher-level agents)
- Memory (short-term and long-term memory between calls)
Here I want to present the four fundamental orchestration patterns that you can easily build with a NAT setup and ReAct:
Pattern 1: Single Agent with Tool Selection
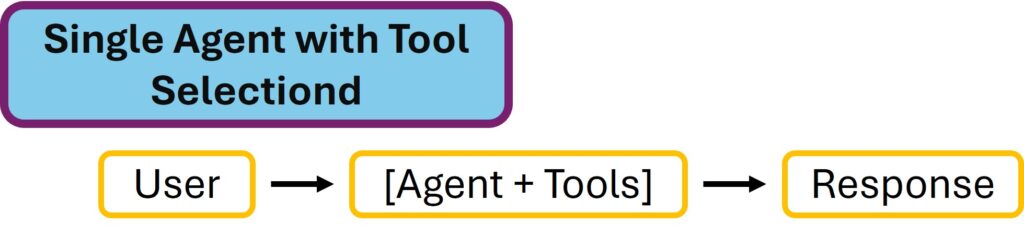
Single Agent with Tool Selection
Pattern 2: Sequential Pipeline
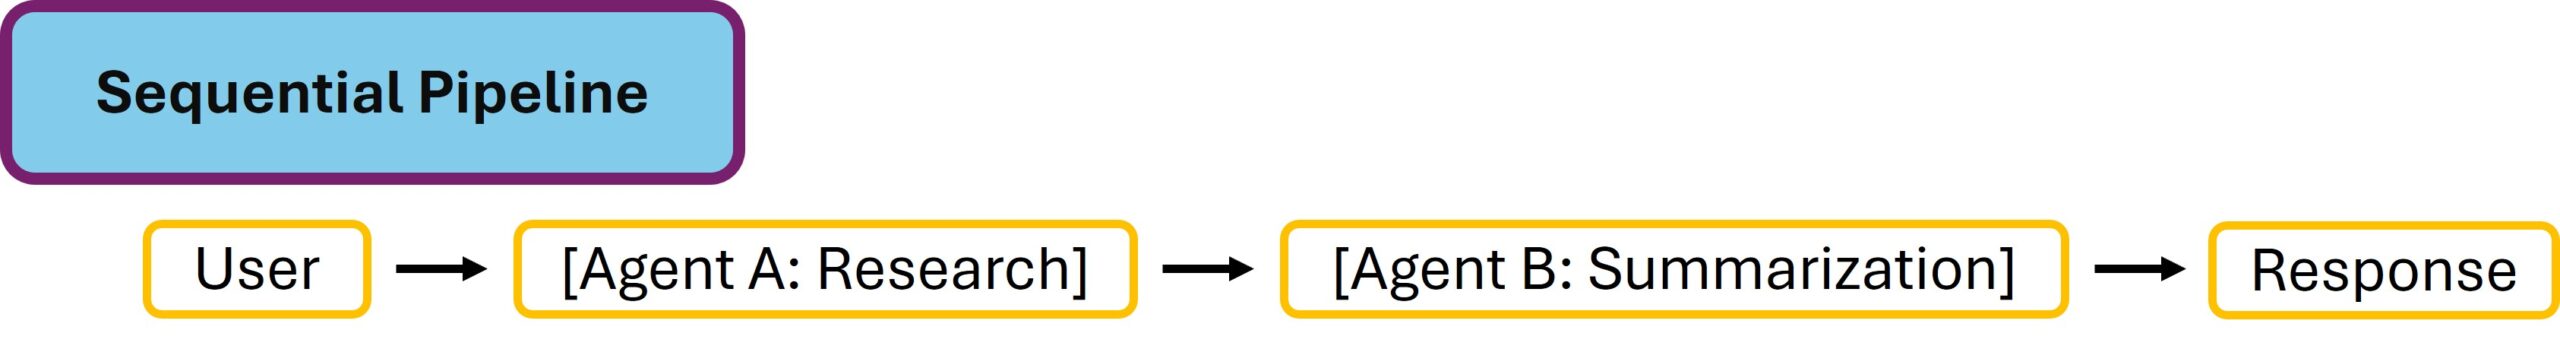
Sequential Pipeline
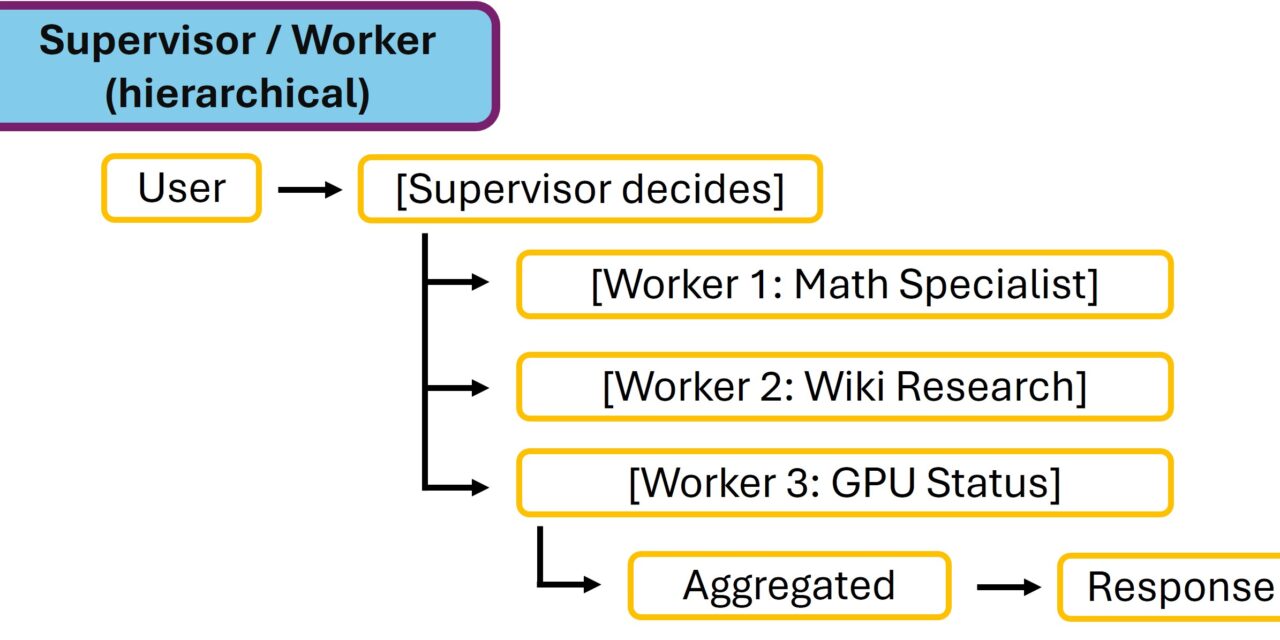
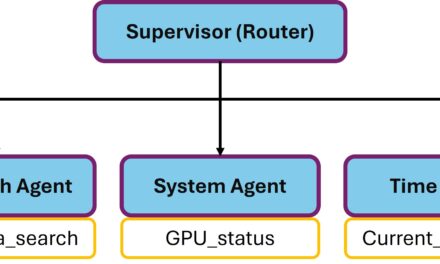
Pattern 3: Supervisor / Worker (hierarchical)
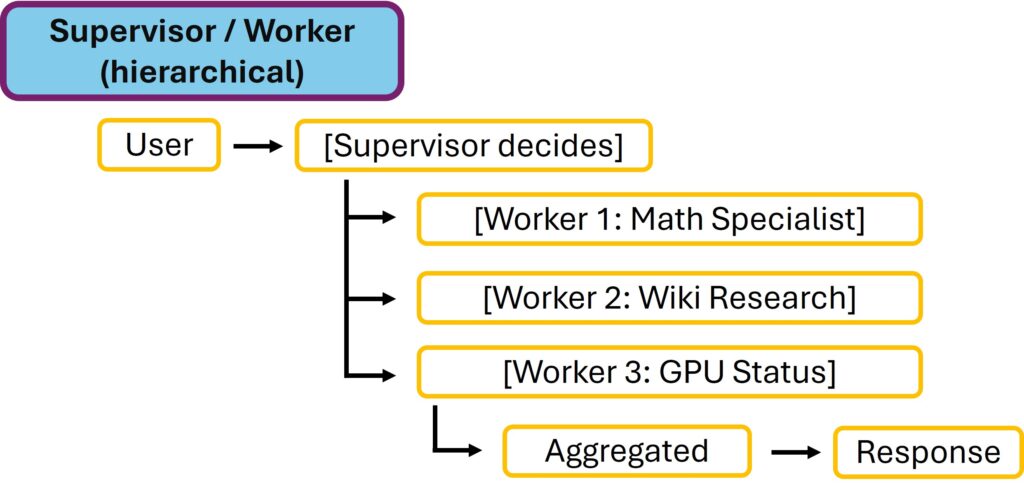
Supervisor / Worker (hierarchical)
Pattern 4: Parallel with Aggregation
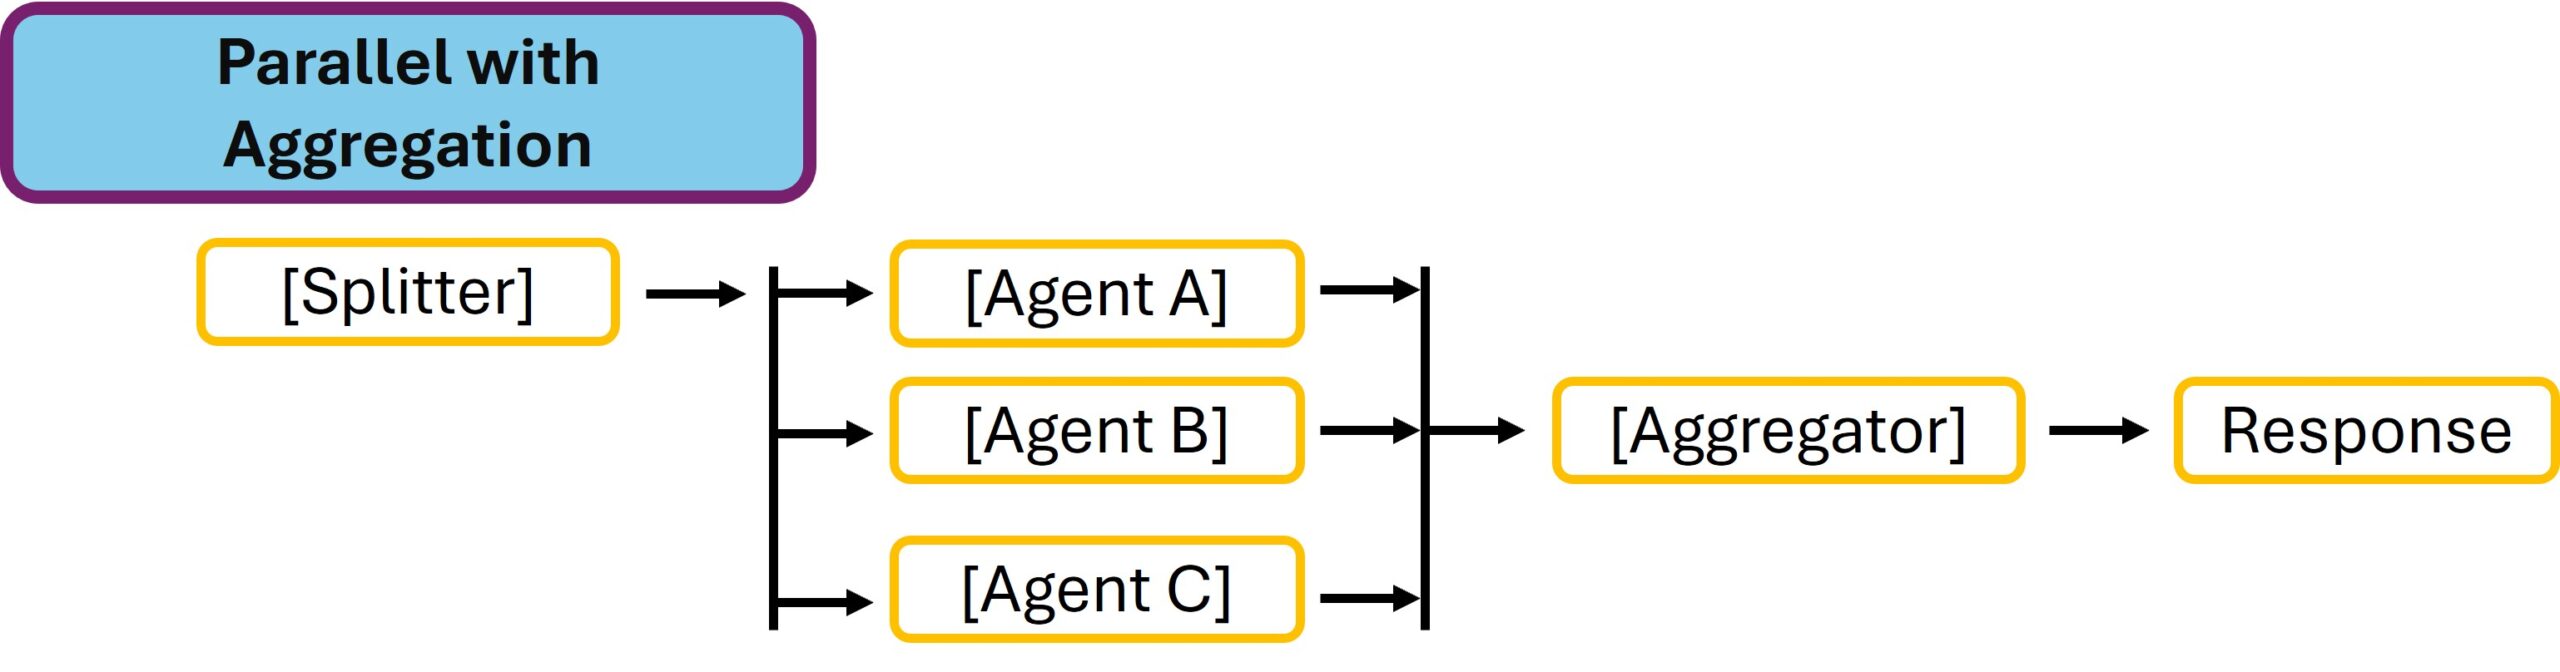
Parallel with Aggregation
The most important conceptual detail in NAT: Everything is a function. A tool is a function. An agent is a function. An entire workflow is a function. This makes NAT enormously composable. We already know this concept from a number of other agentic tools. With this architecture a workflow can use another workflow as a tool, without there being any architectural difference. That is extremely flexible and powerful.
The ReAct loop in detail
Before we build multi-agent setups, we need to understand what happens within a single loop. When you call nat run --config_file ollama_agent.yml --input "...", the following happens:
- Prompt composition
Thesystem_promptis filled in with{tools}and{tool_names}.
Then sent to the LLM: “Here are your tools, here is the question.” - Iteration 1
1. The LLM generates: “Thought: … Action:tool_XAction Input: {…}”
2. NAT parses the format, extractstool_Xand its inputs
3. NAT callstool_X(...)— either a Python function call,
4. an HTTP request, or a database query
5. The result is appended to the context as “Observation: …” - Iteration 2 (if needed)
1. The LLM receives the extended context (Thought+Action+Observation)
2. Decides: another tool or the final answer?
3. If a tool: continue as above. If done: “Final Answer: …” - Output
NAT extracts “Final Answer:” and returns it.
The critical point: the LLM behind the process makes its decision solely on the basis of the tool descriptions. If wikipedia_search is described as “Search Wikipedia for facts” and current_datetime as “Returns the current date and time”, then the LLM learns from these descriptions when to use which tool. That is why it is very important that the tools are described clearly and properly. A duplication of tools with descriptions that are not clearly distinguishable should be avoided when the affected tools return fundamentally different results.
Experiment 1: Tool description influences tool selection
I’ll now assume that you have a working NeMo Agent Toolkit setup available. Let’s take a close look at the process in practice. Create the following workflow:
You are in the active virtual environment of your NAT setup. Now run the following two commands:
Command: cd ~/nat-playground/configs
Now you create the following experiment1_tool_descriptions.yml workflow.
Command: nano experiment1_tool_descriptions.yml
Since there would be far too much of what I’ll call “coding” here, the workflow definition is available in my GitHub repository that goes with this project.
GitHub repository: https://github.com/custom-build-robots/configs/experiment1_tool_descriptions.yml
Now that you have copied the content into the workflow and saved it with CTRL + X followed by a Y. Ollama is running as the inference server, and now you run the workflow three times as follows.
- Question 1: Time-related → should choose current_datetime
- Command:
nat run --config_file experiment1_tool_descriptions.yml--input "What time is it?"
- Command:
- Question 2: Knowledge question → should choose wikipedia_search
- Command:
nat run --config_file experiment1_tool_descriptions.yml--input "What was the Battle of the Teutoburg Forest?"
- Command:
- Question 3: Combined → should call BOTH one after the other
- Command:
nat run --config_file experiment1_tool_descriptions.yml--input "What day is it today and which historical event happened on 13 March 1986?"
- Command:
Take a look at the traces. For question 3 you will probably observe that the agent does not use the date tool for “13 March 1986” (the date is, after all, given in the question), but only for “today”. This is exactly the point: the model understands from the tool name and description what is useful when.
Takeaway: Tool descriptions are your most important lever. When your agent chooses the wrong tool, it usually isn’t that the model is “dumb” but that the description is unclear.
Hands-on: Writing your own Python tool
Now we finally get to the exciting part. Let’s build a GPU status tool that queries nvidia-smi on your server and returns the values. This lets you ask your agent: “How busy is my GPU right now?” and it gets a concrete answer from nvidia-smi about your hardware.
Step 1: Writing the Python tool
Now we are going to leave the config folder of our nat-playground and move into the tools folder. There we place our new tool that we want to build. To do so, please run the following commands.
Command: cd ~/nat-playground/tools
Command: mkdir -p gpu_status
Command: cd gpu_status
Command: nano gpu_status_tool.py
Now you have to download the following tool definition, which I provide here as a Python program named gpu_status_tool.py, from GitHub.
GitHub repository: https://github.com/custom-build-robots/gpu_status/gpu_status_tool.py
Now paste the content, i.e. the Python code, into the file so that you end up with the tool stored in the folder ~/nat-playground/tools/gpu_status. Save with Ctrl + X followed by a Y.
Step 2: Registering the tool as a package
NAT recognizes custom tools via Python entry points. We need a small pyproject.toml:
Command: ~/nat-playground/tools/gpu_status
Command: nano pyproject.toml
Again, the same procedure. The content of the pyproject.toml is available here on GitHub.
GitHub repository: https://github.com/custom-build-robots/gpu_status/pyproject.toml
Step 3: Installing the tool in the active venv
Now please switch to the nat-playground folder to register the tool.
Command: cd ~/nat-playground
If the virtual environment is not active, please activate it.
Command: source .venv/bin/activate
With the following command the gpu_status tool is installed.
Command: uv pip install -e tools/gpu_status
The -e flag means “editable install”, which is super handy because when you change something in the Python code, you don’t have to reinstall the tool.
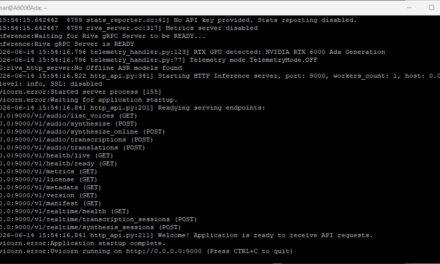
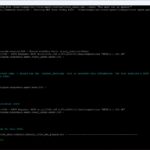
For me, the output in the terminal window then looked like this.
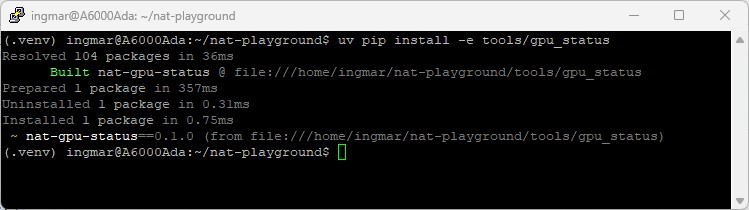
NAT GPU NVIDIA-SMI – tool
Step 4: Verifying that NAT sees the tool
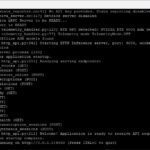
Now comes the exciting part: does our NAT setup know about the new tool? To find out, run the following command.
Command: nat info components -t function | grep -i gpu
For me the output looked like the image shown below.
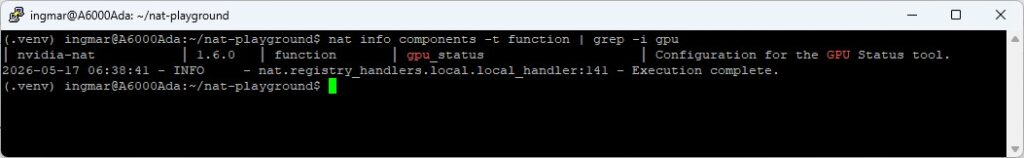
NAT GPU NVIDIA-SMI – tool installed
Step 5: Building a workflow with the new tool
Now, to build the new workflow, we have to go back into the configs folder.
Command: cd ~/nat-playground/configs
We create the new workflow with the following command.
Command: nano experiment2_gpu_agent.yml
You’ll find the workflow itself again in my GitHub repository. Paste the content into experiment2_gpu_agent.yml and then save the file.
GitHub repository: https://github.com/custom-build-robots/configs/experiment2_gpu_agent.yml
Step 6: Running the first hardware agent
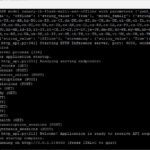
Now we run the workflow experiment2_gpu_agent.yml, which calls our gpu_status tool and will hopefully return the GPU utilization.
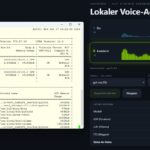
Command: nat run --config_file experiment2_gpu_agent.yml --input "How busy is my GPU right now and is inference work running?"
The answer I received was: “Yes, the GPU is currently heavily loaded with a utilization of 92%. Inference work is being carried out. Memory usage is only 15.1%, the temperature sensor reads 38°C and power consumption is 248.77W.”
And here is the matching image:
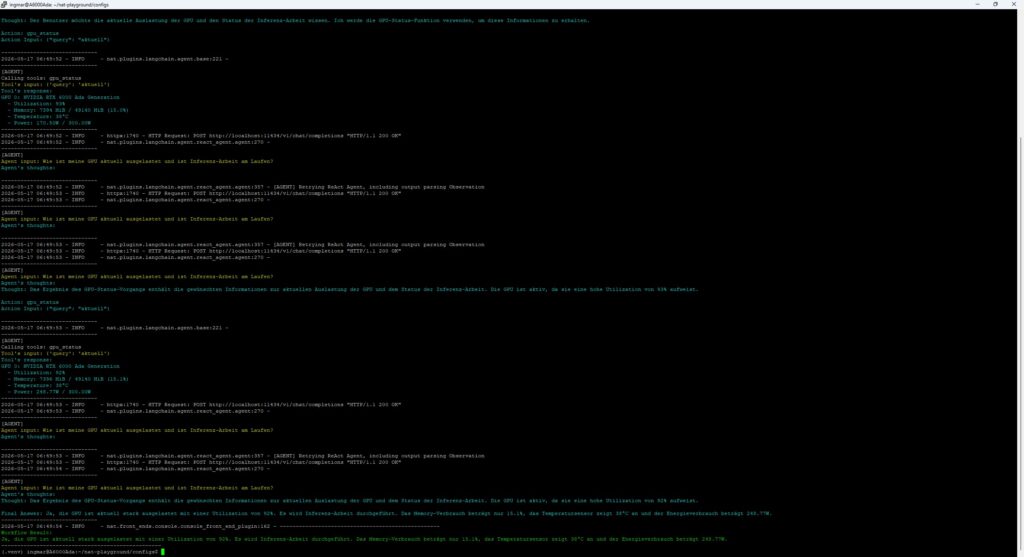
NAT GPU NVIDIA-SMI – tool result
Perfect — now you have built your own first tool that reads system information directly from your inference machine.
Congratulations, you have now created your first own tool.
The tutorial offers a clear and practical guide for setting up and running the Tensorflow Object Detection Training Suite. Could…
This works using an very old laptop with old GPU >>> print(torch.cuda.is_available()) True >>> print(torch.version.cuda) 12.6 >>> print(torch.cuda.device_count()) 1 >>>…
Hello Valentin, I will not share anything related to my work on detecting mines or UXO's. Best regards, Maker
Hello, We are a group of students at ESILV working on a project that aim to prove the availability of…