

My Hermes Agent has been running productively on my application server for several weeks: as a Telegram gateway, with a connected MCP server for GPU monitoring, and with a few cron jobs for daily background tasks. So far, I’ve configured everything via the CLI and directly in ~/.hermes/config.yaml. That works wonderfully, but it’s not always the fastest way. A web dashboard is much better when I quickly want to search through an old session, look at token analytics, or set up a new cron job on the fly.
Since one of the recent updates, Hermes comes with a complete web dashboard. By default, however, it only binds to 127.0.0.1 and has to be started manually. But I want to be able to access the dashboard from many different devices on my network. In this post, I’ll show you how I set up the Hermes Agent dashboard as a systemd service under Ubuntu. A certain level of protection is also essential, since the dashboard out of the box has no authentication of its own.
What does the dashboard offer?
Before we get started, a brief overview of what the dashboard actually delivers:
- Status – live view of agent version, gateway status, connected platforms, and active sessions
- Chat – the complete Hermes TUI directly in the browser (optional, requires
ptyprocess) - Config – form-based editor for the
config.yamlwith all 150+ fields - API Keys – management of the
.envfile with all provider keys - Sessions – full-text search across all previous conversations using FTS5
- Logs – live tailing of agent, gateway, and error logs with filters
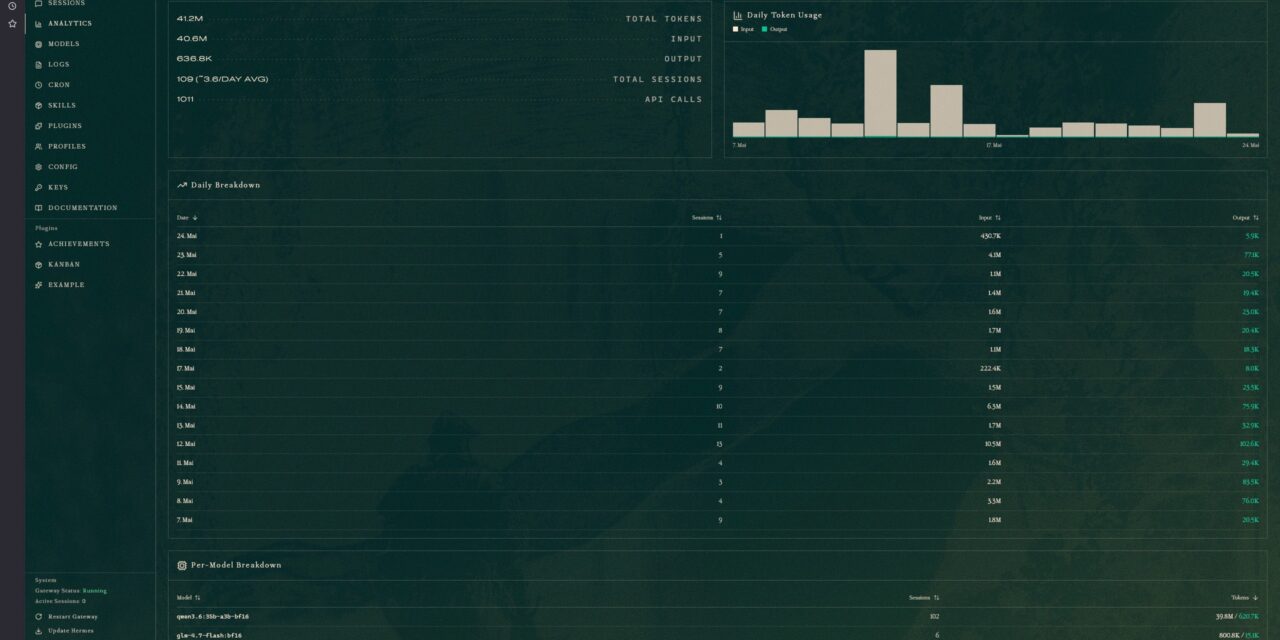
- Analytics – token usage and estimated cost per day and model
- Cron – UI for scheduled jobs without crontab editing
- Skills – enabling and disabling individual skills and toolsets
The full-text search across all sessions is especially important for me, since it lets me rediscover code snippets and setup notes from conversations that are months old.
Prerequisites
- Ubuntu 24.04 LTS or comparable, with active systemd
- Hermes Agent v0.6.0 or newer
- Python 3.12 – default under Ubuntu 24.04
- Node.js, if you want to use the chat tab in the browser
- UFW for firewall protection
Step 1: Install the web extras
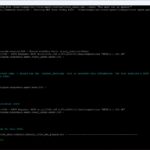
The default installation of Hermes doesn’t include the HTTP stack. You need that HTTP stack as an extra. I ran the following commands to install everything into Hermes’s own virtual environment.
Command: cd ~/.hermes/hermes-agent
Command: source venv/bin/activate
Command: uv pip install -e ".[web,pty]"
Command: deactivate
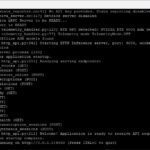
Now everything should be ready. For a quick functional test, I start the dashboard directly with network binding so that I can also access it from my client machine:
Command: hermes dashboard --host 0.0.0.0 --port 9119 --no-open --insecure
The --no-open prevents the headless-running server from trying to open a browser. --insecure is not a real security switch, but a deliberate confirmation from Hermes itself: “yes, I know that I’m not binding to localhost only” — as soon as you set --host 0.0.0.0, the flag is mandatory.
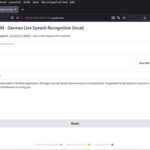
In the browser on your client, you now open http://<server-ip>:9119 and should see the dashboard. On my end, it looks like this:
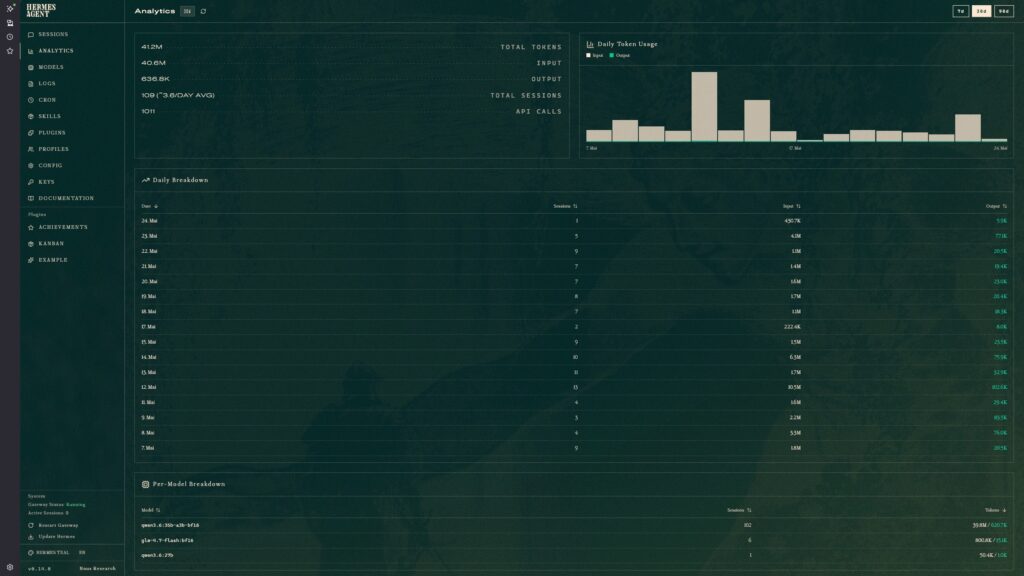
Hermes Agent – Web Dashboard
Stop the test again with CTRL+C in your SSH terminal. Now I want to set up the dashboard so that it runs cleanly as a systemd service in the background and I can access it at any time.
Step 2: Create the systemd service
Now to the central part. Create a new service file:
Command: sudo nano /etc/systemd/system/hermes-dashboard.service
Then please insert the following service configuration and save the file.
[Unit]
Description=Hermes Agent Web Dashboard
After=network.target
Wants=network-online.target
[Service]
Type=simple
User=ingmar
Group=ingmar
Environment="HOME=/home/ingmar"
WorkingDirectory=/home/ingmar/.hermes/hermes-agent
ExecStart=/home/ingmar/.hermes/hermes-agent/venv/bin/hermes dashboard --host 0.0.0.0 --port 9119 --no-open --insecure
Restart=on-failure
RestartSec=10
[Install]
WantedBy=multi-user.target
Four points are important here:
--host 0.0.0.0binds to all network interfaces — only with this flag will the dashboard be reachable from every device on the LAN.--port 9119is Hermes’s default port for the dashboard. If the port is already taken on your system (e.g. by another local service), pick a free port — for example--port 8119.--insecureis mandatory as soon as you no longer bind the Hermes Agent dashboard to the local IP127.0.0.1. The flag explicitly confirms that you are aware of the risks.- Path to the hermes binary points directly into the Hermes-owned venv at
~/.hermes/hermes-agent/venv/bin/hermes. That way systemd bypasses the launcher detour through~/.local/bin/, and nothing can go wrong if the service account’s PATH is minimal. Verify the path before the first start withls -la ~/.hermes/hermes-agent/venv/bin/hermes.
Now we need to activate and start the newly created service:
Command: sudo systemctl daemon-reload
Command: sudo systemctl enable --now hermes-dashboard
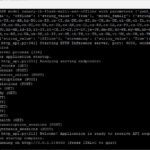
Command: sudo systemctl status hermes-dashboard
If the status is green, the dashboard is running and is reachable from every machine on the network. That’s both a feature and a problem at the same time.
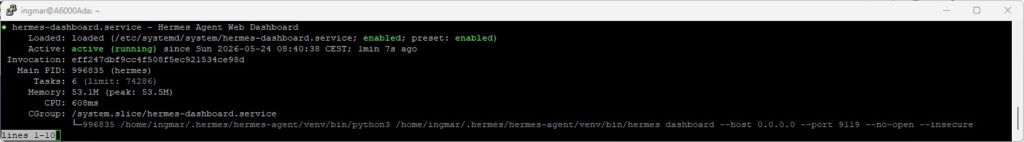
Hermes-Agent – WEB Dashbaord service status
Step 3: Restrict to your own LAN with UFW
The dashboard reads and writes the .env file with all the API keys. Anyone with network access to port 9119 would have full access to them. My minimum protection: only allow the port for my internal subnet.
Command: sudo ufw allow from 192.168.2.0/24 to any port 9119 proto tcp
Command: sudo ufw reload
Replace 192.168.2.0/24 with your own LAN subnet. With this, no one from the Internet can get through anymore, even if your router were misconfigured.
Checking the logs
If something goes wrong, a look at the systemd journal helps:
Command: journalctl -u hermes-dashboard -f
My personal takeaway
The dashboard is exactly the comfort layer that an actively used Hermes Agent has been missing. The full-text search across my sessions has already paid off several times after just three days. With it, I rediscover snippets and setup notes from conversations that I would otherwise have had to piece together manually. The analytics are insightful too: I see exactly how many tokens my models produce per day, both inbound and outbound. With a cloud solution, that’s the spot where you’d monitor costs so you could cross-check them against the monthly invoice from the service provider. On my end, it just ends up as a number on the token balance — thankfully, I don’t have to pay anything for it. The GPUs are connected to the solar system and draw their few kilowatts from the PV system or the battery storage when the sun is shining. Which is, of course, tricky from the end of October to the end of March here in Germany.
The only hurdle for me was the missing authentication. That’s a deliberate design decision, since the Hermes Agent is intended as a local developer tool — but as soon as you expose it to the LAN, you have to take care of it yourself. An nginx with Basic Auth is the pragmatic middle ground between “running on 0.0.0.0 and everything is open” and “I ship my connection metadata into a cloud VPN solution”.
For me, this is exactly the setup that fits sovereign AI in the home network: everything stays local, no one needs a cloud account, and yet I have the same convenience as with any SaaS solution.
Have fun setting it up!


The tutorial offers a clear and practical guide for setting up and running the Tensorflow Object Detection Training Suite. Could…
This works using an very old laptop with old GPU >>> print(torch.cuda.is_available()) True >>> print(torch.version.cuda) 12.6 >>> print(torch.cuda.device_count()) 1 >>>…
Hello Valentin, I will not share anything related to my work on detecting mines or UXO's. Best regards, Maker
Hello, We are a group of students at ESILV working on a project that aim to prove the availability of…