

In my last posts I built the inference layer (Ollama, TensorRT-LLM) and the orchestrator layer (NeMo Agent Toolkit) on my application server in combination with my AI server. What’s been missing is a meaningful bridge between these server layers and the world of embedded devices in my workshop. That was the moment I took a closer look at the Model Context Protocol (MCP). My idea is that my first own MCP server should be something I can actually use: GPU monitoring for the two RTX A6000 cards in my inference server.
Concretely: I want to know from completely different devices, for example my ESP-Claw with LED ring, how busy my GPUs are right now. No Grafana, no cloud service, but a lightweight, locally running MCP-standard server that outputs exactly the metrics I need. And in the end my ESP-Claw-based setup should be able to query it via MCP client. I’m curious whether it’ll work and what I’ll learn along the way.
In this post I’ll show you how I built the MCP server. It’s written in Python, I’ll use pynvml for the GPU utilization and FastMCP, including multi-GPU support, EMA smoothing for a calmer display, and an optional setup as a systemd service so the MCP server always runs in the background.
Once the small programs are finished I’ll link them inline to my GitHub repository.
What’s this actually about?
Before we get started, a quick look at the architecture so it’s clear what I want to achieve:
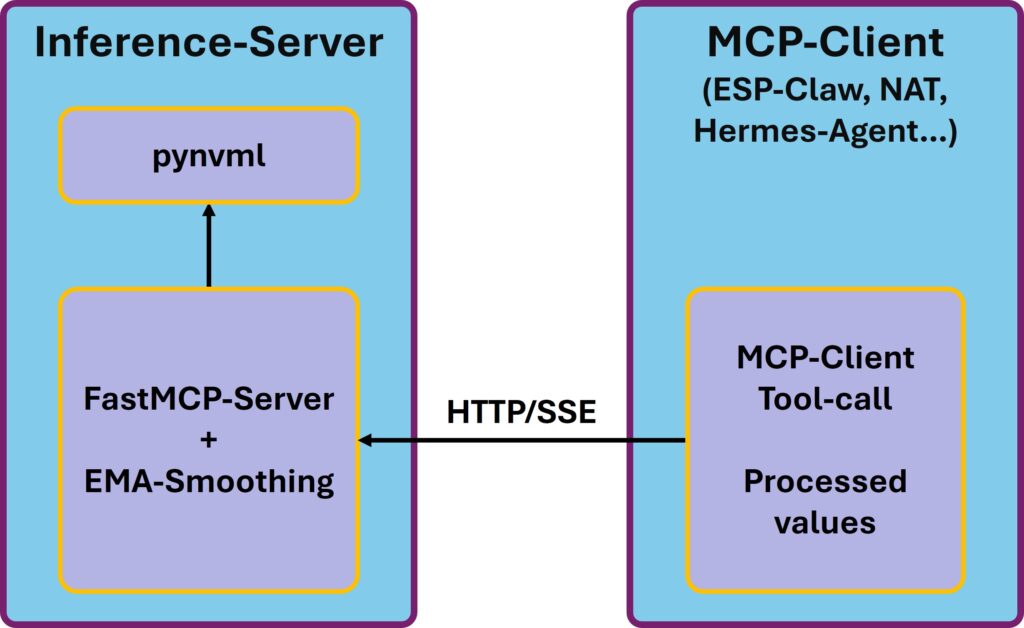
MCP Server – GPU load
An MCP server exposes tools that an MCP client can call over a standard protocol. The nice thing: as long as the client speaks MCP – and many do by now – it doesn’t matter what’s on the other end. My server will therefore be useful not just for the ESP-Claw, but also for my Hermes Agent, the NeMo Agent Toolkit, any LangChain agent with MCP support, or my own Python scripts. All of these clients can check what kind of load is currently on the inference server.
pynvml is the Python binding to the NVIDIA Management Library (NVML) – exactly the library we need to read out the data. That way we get structured values directly from the inference server.
FastMCP is a lightweight Python library that implements the MCP protocol for us. NVIDIA itself uses FastMCP in the NeMo Agent Toolkit to publish workflows as MCP servers – we’ll use it here in the standalone variant.
EMA (Exponential Moving Average) is needed because raw GPU utilization is jumpy. During an inference request the value jumps from 0 to 100% within milliseconds and back. Whoever sends that unfiltered to an LED ring will see nervous flickering instead of a pleasant display. EMA smooths that out.
Prerequisites
Before we get started, a couple of things that need to be in order:
- Ubuntu 24.04 LTS (or a comparable Linux)
- At least one NVIDIA GPU with current drivers (mine is a dual RTX A6000 Ada, but any CUDA-capable card works)
- Python 3.11, 3.12 or 3.13 on the host – Ubuntu 24.04 ships with 3.12
uvas the package manager – if you remember my NAT post, we installed it there. If not:curl -LsSf https://astral.sh/uv/install.sh | sh- A network setup in which your MCP client can reach the server (LAN is enough, no internet required)
If you still need to prepare your server for AI inference in general, take a look at my foundation post first.
Step 1: Install pynvml and test GPU detection
We start with the absolute basics: can Python even talk to the NVIDIA driver? For that we create a project directory, a dedicated Python environment, and install pynvml.
Command: mkdir -p ~/gpu-monitor-mcp && cd ~/gpu-monitor-mcp
Command: uv venv --python 3.12 --seed .venv
Command: source .venv/bin/activate
There are two packages on PyPI with almost identical names and a confusing history. nvidia-ml-py is the official package maintained by NVIDIA. That’s exactly what we want to install now. There’s also another package called pynvml, which used to be an independent third-party library, is meanwhile maintained by the NVIDIA RAPIDS team and has been officially deprecated since version 13 (September 2025). It now only pulls in nvidia-ml-py as a dependency, so technically it still works – but we shouldn’t use it anymore. Install nvidia-ml-py directly.
Command: uv pip install nvidia-ml-py
Even so, the Python import is simply pynvml – the official package installs the module under that name. Confusing, but that’s how it grew historically.
For testing, let’s create a small script. In the terminal, run the following command. I use nano:
Command: nano test_gpus.py
Now paste the following Python code into the still empty test_gpus.py file.
import pynvml

pynvml.nvmlInit()
count = pynvml.nvmlDeviceGetCount()
print(f"GPUs found: {count}\n")

for i in range(count):
    handle = pynvml.nvmlDeviceGetHandleByIndex(i)
    name = pynvml.nvmlDeviceGetName(handle)
    util = pynvml.nvmlDeviceGetUtilizationRates(handle)
    mem = pynvml.nvmlDeviceGetMemoryInfo(handle)
    temp = pynvml.nvmlDeviceGetTemperature(handle, pynvml.NVML_TEMPERATURE_GPU)

    print(f"GPU {i}: {name}")
    print(f"  Utilization: {util.gpu}%")
    print(f"  VRAM: {mem.used / 1024**3:.1f} / {mem.total / 1024**3:.1f} GB")
    print(f"  Temperature: {temp} °C\n")

pynvml.nvmlShutdown()
Save the file with CTRL + X, then Y and ENTER. Now we can run it with the following command:
Command: python test_gpus.py
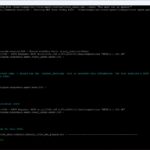
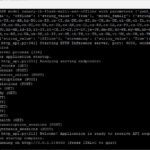
On my machine, the little Python program shows the following. With this I have confirmation that I can access the data for both my GPUs:
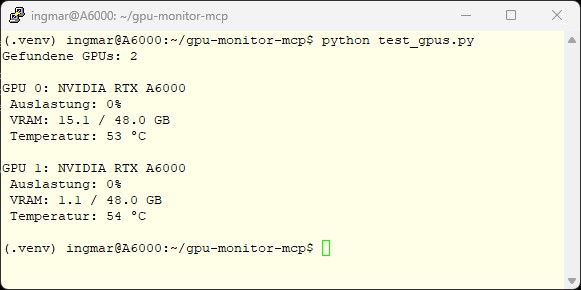
nvidia-ml-py – Server GPU load
If it works for you too, your drivers and pynvml are fine. If not, please check the pitfalls section at the end.
Step 2: Install FastMCP
Now we still need to install the fastmcp library into our virtual environment:
Command: uv pip install fastmcp
This pulls in about 40 to 50 packages and went incredibly fast. Among them are the HTTP stack, Pydantic, the MCP SDK and a bit more. With uv the whole thing is done within a few seconds.
To verify everything worked, please run the following command once.
Command: python -c "from fastmcp import FastMCP; print('FastMCP ready')"
In my case the output was “FastMCP ready”. If no errors appear, we’re good to go and have the foundation to build the MCP server.
Step 3: Write the minimal MCP server
We start with an absolutely minimal server that exposes only a single tool – namely the number of installed GPUs. Only once that runs will we extend the MCP server step by step.
Command: nano gpu_monitor.py
"""
GPU Monitor MCP Server – Step 1: Minimal test
"""
import pynvml
from fastmcp import FastMCP

# Initialize NVML once at server start
pynvml.nvmlInit()
GPU_COUNT = pynvml.nvmlDeviceGetCount()

# Create the MCP server with a descriptive name
mcp = FastMCP(name="GPU Monitor")

@mcp.tool()
def get_gpu_count() -> int:
    """Returns the number of available GPUs."""
    return GPU_COUNT

if __name__ == "__main__":
    # Listen on all interfaces so clients on the LAN can connect.
    # Port 8765 – you can also choose another one.
    mcp.run(transport="sse", host="0.0.0.0", port=8765)
What exactly is happening in this small script that provides us with an MCP server?
pynvml.nvmlInit()runs exactly once at server start – we don’t want to repeat the NVML initialization on every tool request, that would be wasteful.FastMCP(name="GPU Monitor")creates the server.- The
@mcp.tool()decorator marks a Python function as an MCP tool. FastMCP automatically uses the type hints (-> int) and the docstring to tell clients what the tool does. This is exactly the description an LLM will later read to decide when to call the tool. mcp.run(transport="sse", ...)starts the server with Server-Sent Events (SSE) as the transport. That’s HTTP-based and works cleanly over the network, in contrast to the default transportstdio, which only works locally via pipes.
If you haven’t saved the little Python script (our MCP server) yet, do it now. Save the file with CTRL + X, then Y and ENTER.
With the following command we execute the Python script and start the FastMCP server.
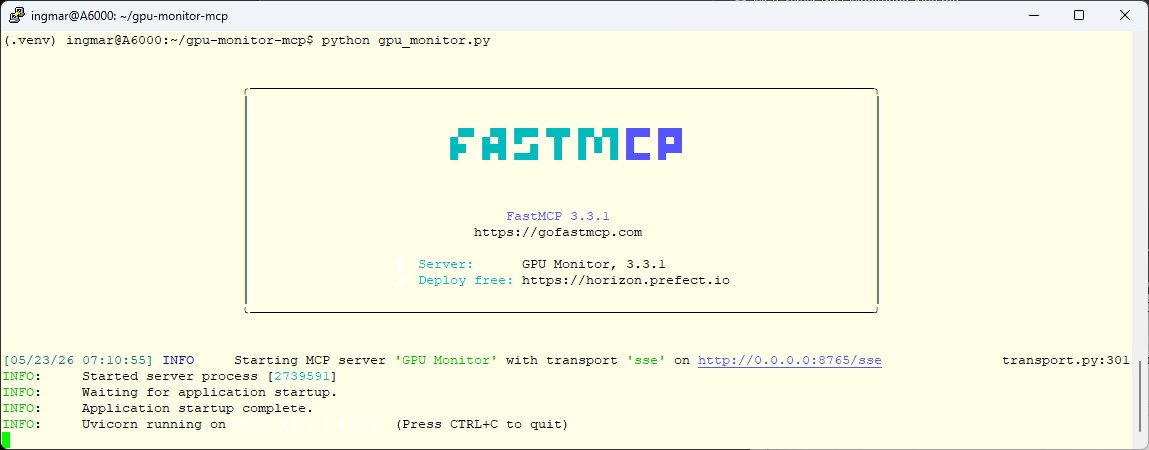
Command: python gpu_monitor.py
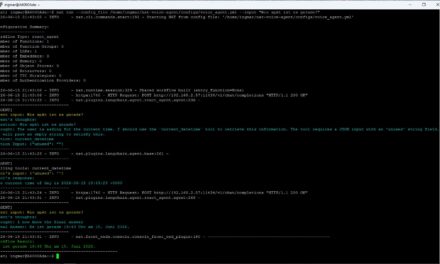
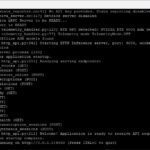
Now the FastMCP server should start and your terminal window should show the following.
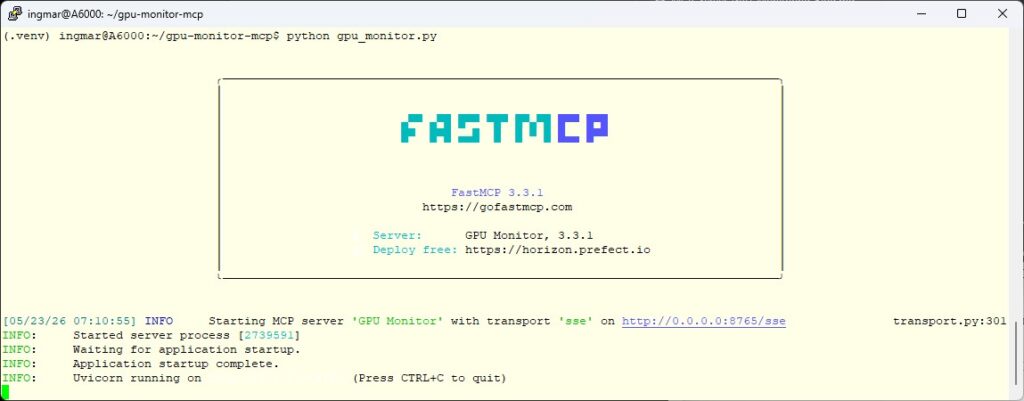
Fast-MCP Server – Server GPU load
With this, your first own MCP server is running, and we can now extend it further.
If you want to test the MCP server now, you can’t just open its URL in a browser. If you’re tempted to simply open http://192.168.2.57:8765/ in your browser, you’ll only get a ‘Not Found’ message. That’s not an error. MCP servers are not websites and don’t expose anything at the root URL. We need a proper MCP client for testing.
So to see anything you need an MCP Inspector on your machine. Since I’m running Windows on the client side, I installed Anthropic’s MCP Inspector via PowerShell with the following command:
Command: npx @modelcontextprotocol/inspector
After installation – assuming you didn’t have it installed yet – a browser window opens. In the top left, make sure to switch the Transport Type to SSE (*1). Then enter the IP address of your FastMCP server with port and /sse at the end (*2). In my case it’s:
URL: http://192.168.2.57:8765/sse
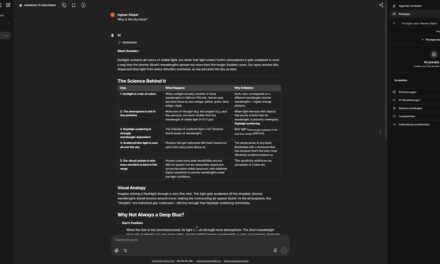
In the following image you can see at (*3) that the connection worked and the name “GPU Monitor” of our MCP server is displayed.
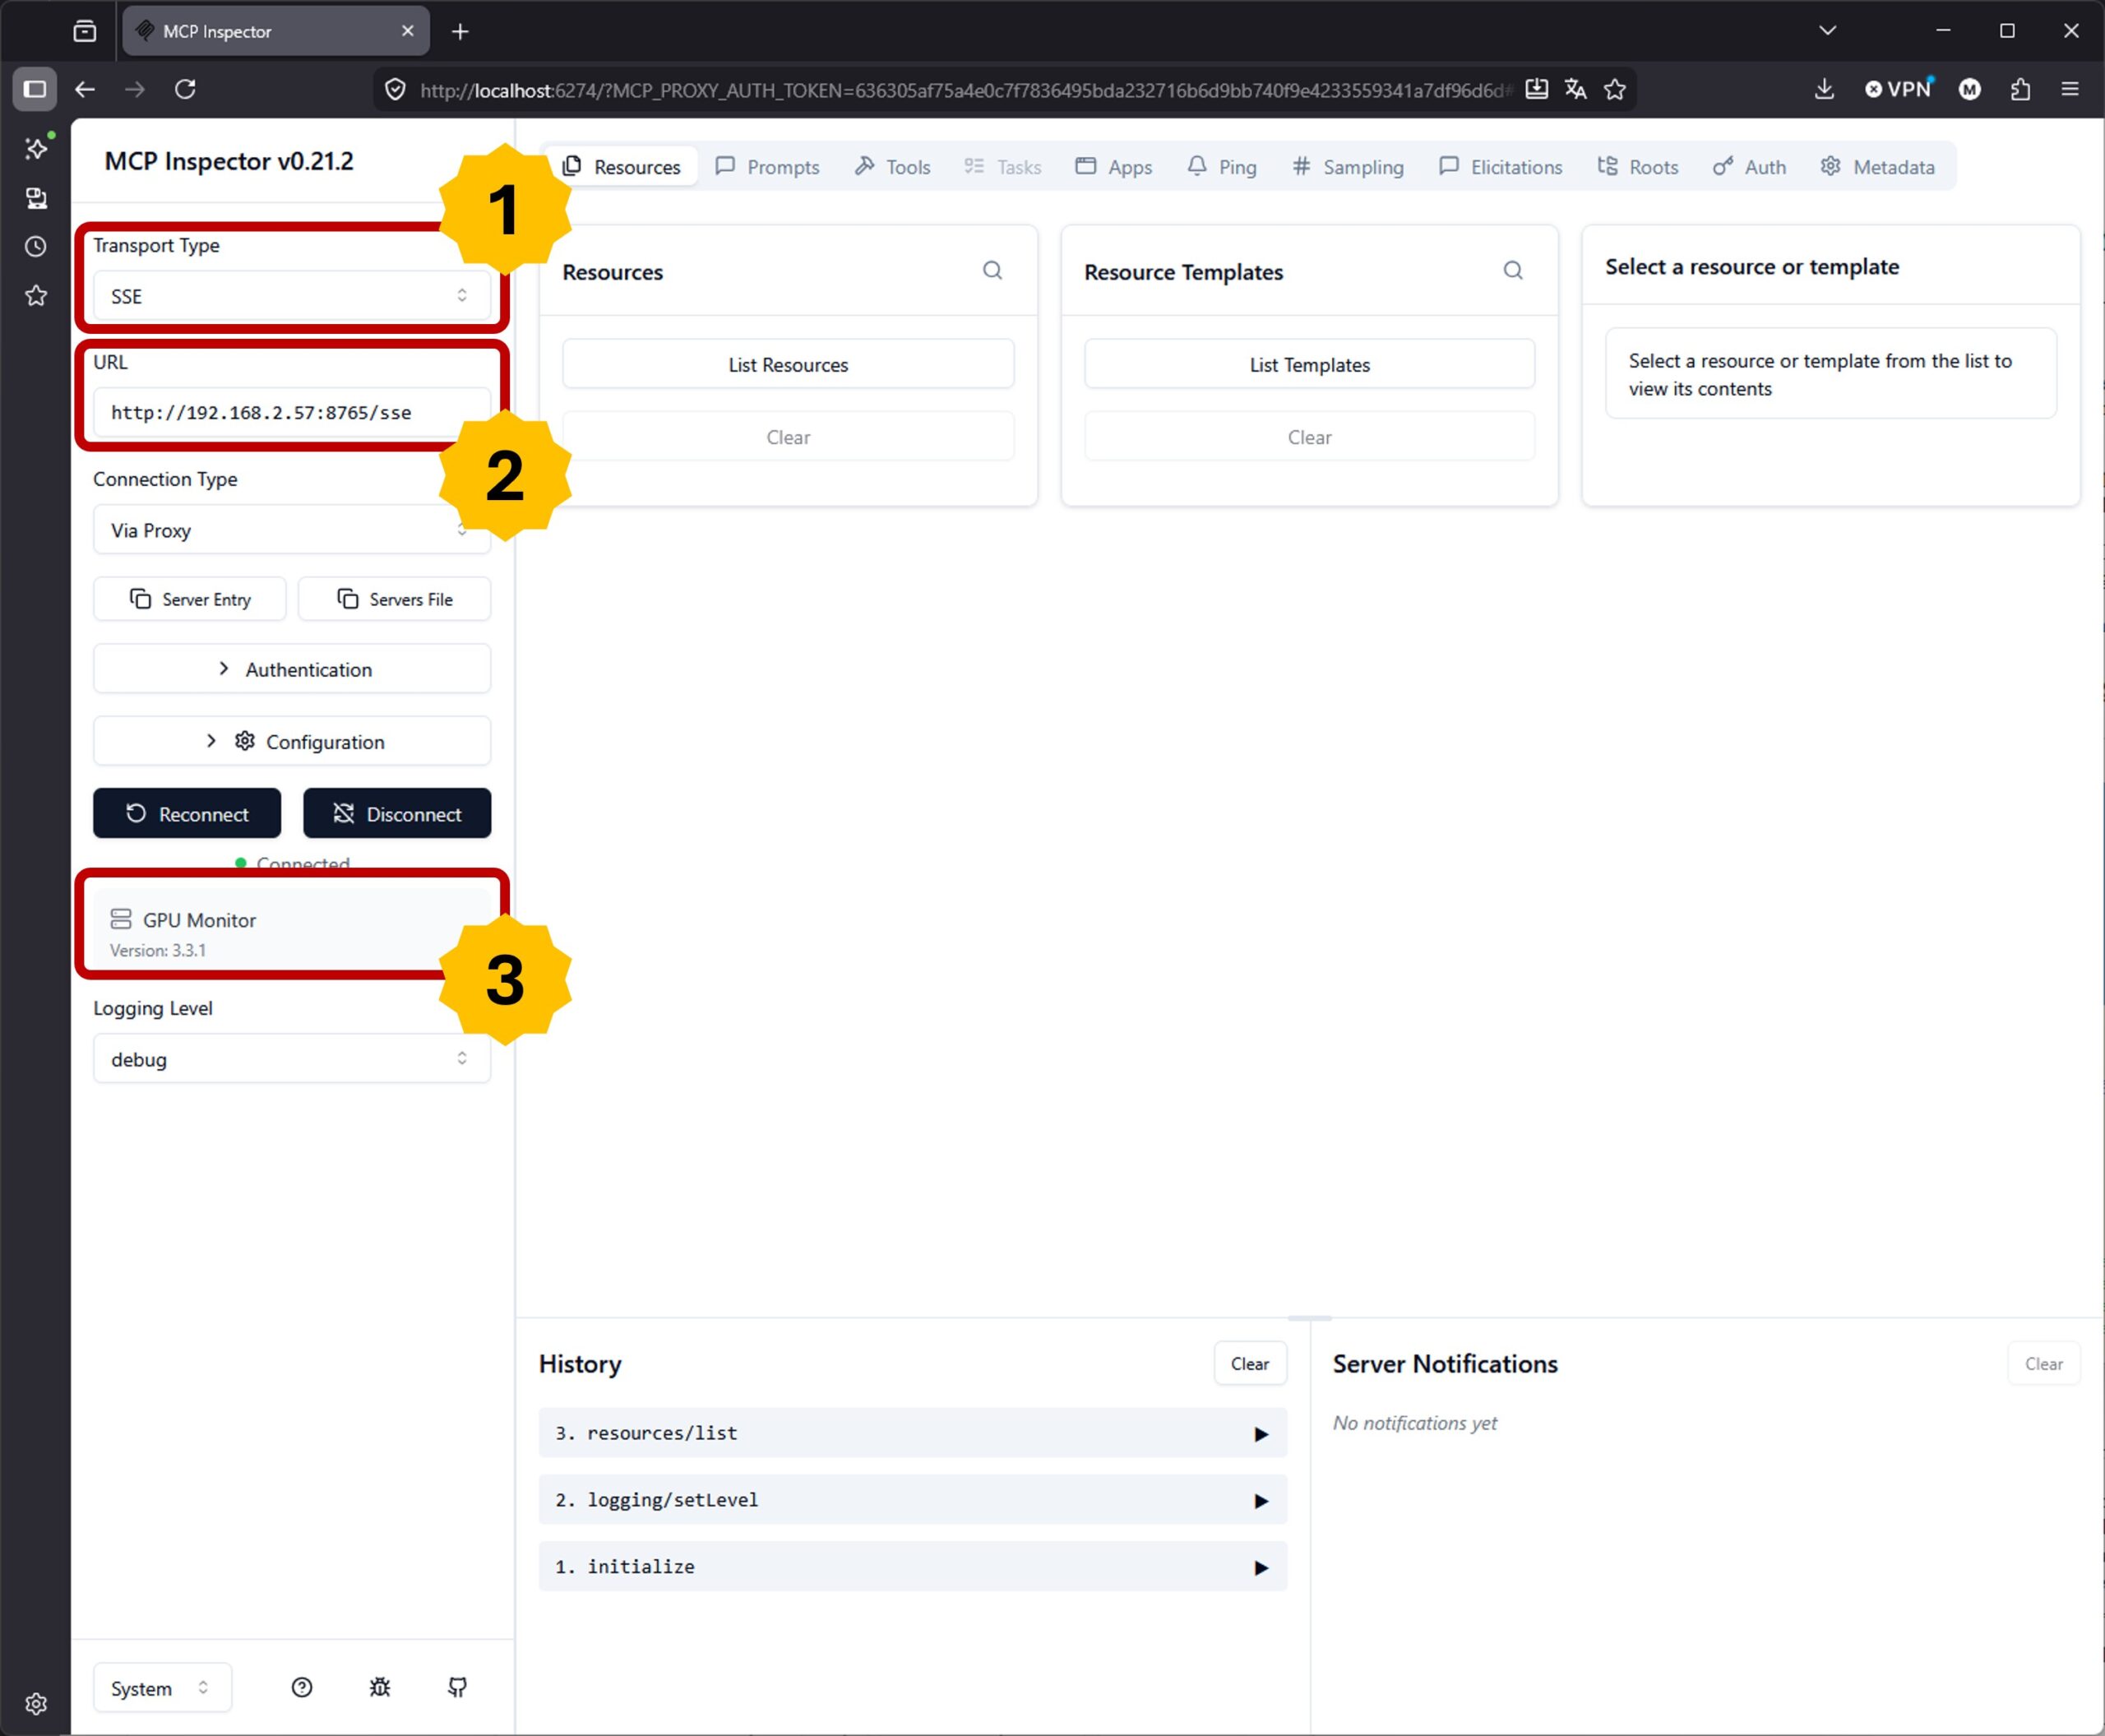
MCP-Inspector
You can now stop the MCP server in the terminal with CTRL + C. Next, we’ll move on to the actual functionality and develop our MCP server into a real GPU monitor service.
Step 4: Add multi-GPU utilization and memory usage
Now we’ll extend the MCP server, or rather our small script, with the actually interesting tools. We adapt the gpu_monitor.py Python file and replace the previous content with the following code that I’ve made available on GitHub, since it would be too long here and not pretty when embedded inline.
URL: gpu_monitor.py
Three important points about this code:
- Each tool has a
gpu_idparameter with a default of0. This way, single-GPU and multi-GPU systems work transparently. With ID 0, a client that only knows one GPU can omit the parameter. Multi-GPU clients can explicitly query each individual GPU. I implemented it this way because I want my ESP-Claw to display both GPUs on a 24-LED ring. - Each tool returns a dictionary, not a tuple or a list. That makes the response structure self-explanatory. The LLM client will later see keys like
"temperature_c", not an anonymous number. - The docstrings are carefully written. FastMCP passes them along to the client, and an LLM agent decides based on this description when to invoke your tool. Better docstrings → better tool selection. I still need to gather more experience here on what kind of description works well with which model.
Once you’ve restarted the small MCP server after the changes and refreshed the MCP Inspector, you should see the newly added tools. In my case it looks like this:
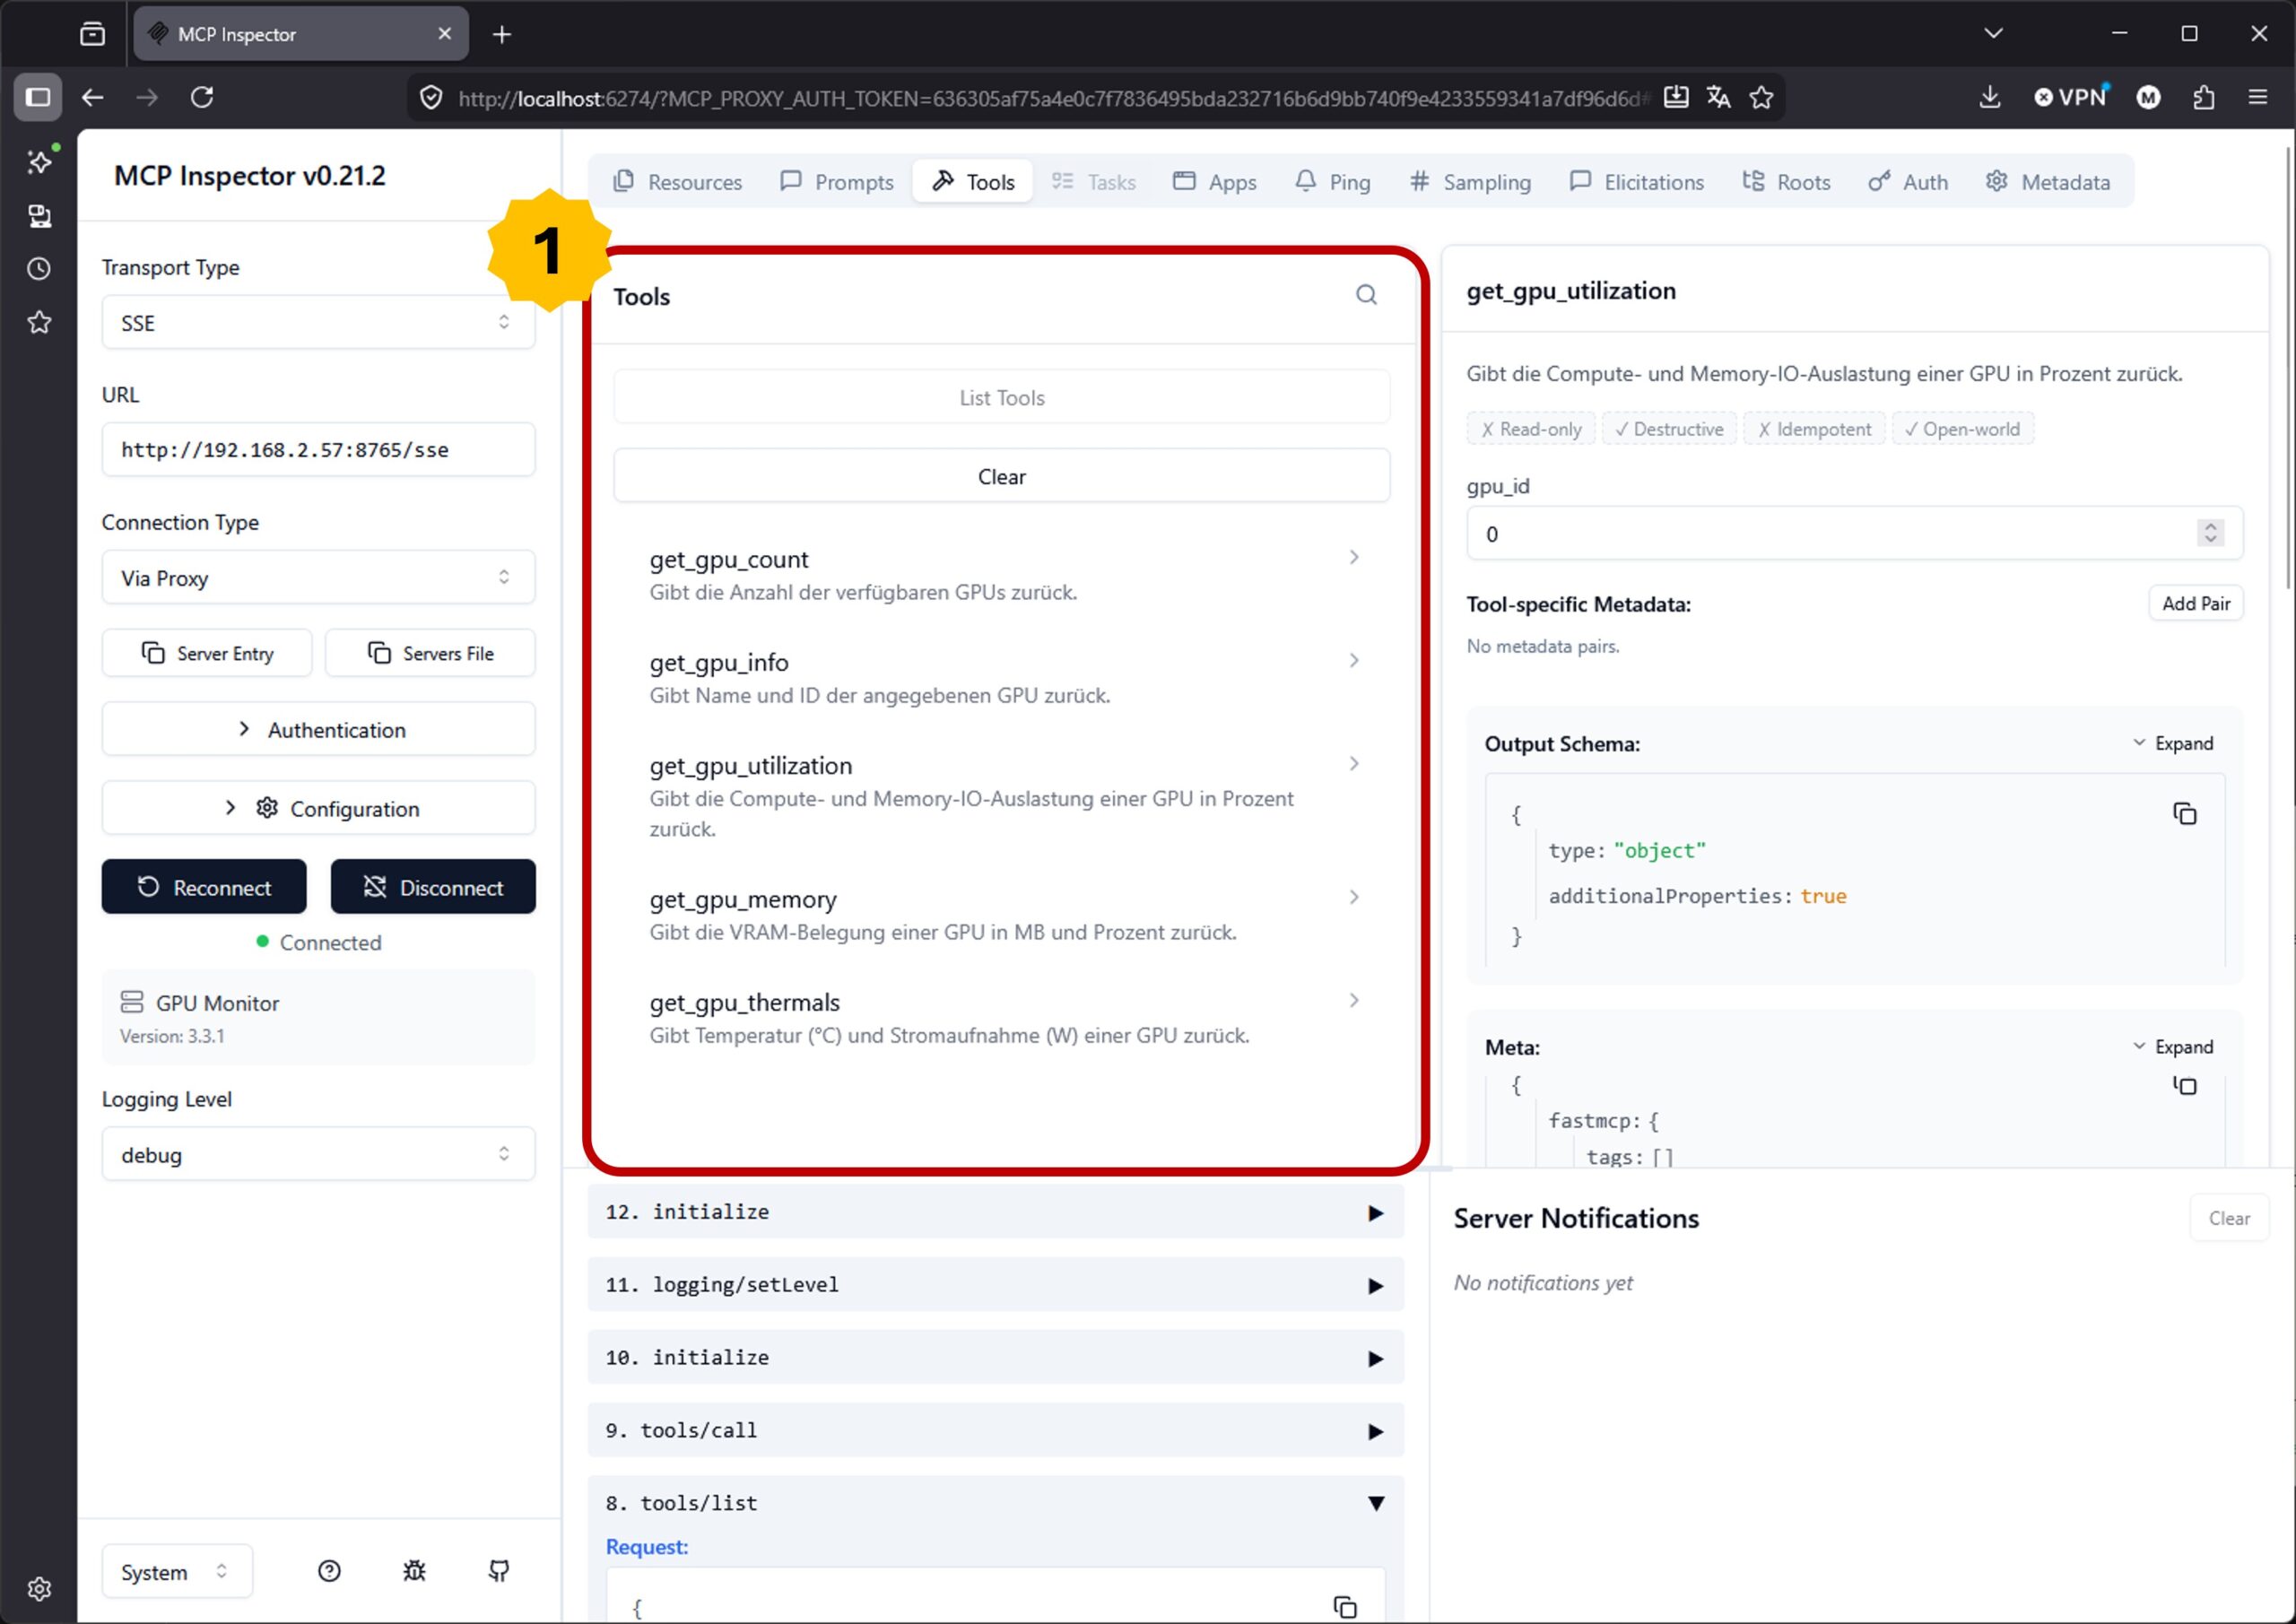
MCP inspector tools overview
You can already list the number of GPUs if you want. In other words, invoke the tools of your MCP server.
Step 5: Integrate EMA smoothing
Now comes the actual core: the Exponential Moving Average. The idea in one line:
new_smoothed_value = alpha × new_raw_value + (1 - alpha) × old_smoothed_valuealpha is the smoothing factor between 0 and 1. A high value (e.g. 0.7) means the server reacts quickly to changes with little smoothing. A low value (e.g. 0.1) means heavy smoothing and slower reaction. For GPU displays on the LED ring I got very good results with alpha = 0.3. That’s fast enough to make peaks visible, calm enough not to flicker, and it also works reliably over a long WAN connection.
We build the smoothing into a small class so it keeps its state across multiple tool calls. For this, we adapt the gpu_monitor.py Python file once more and replace the previous content with the following code, which I’ve made available on GitHub since it would be too long here and not pretty inline.
URL: gpu_monitor_EMA.py
What’s changed compared to Step 4?
- The
EMASmootherclass is new. It keeps a separate smoothed value per key (e.g.gpu0_compute,gpu1_compute). That way the GPUs don’t get mixed up. get_gpu_utilization()has a new parametersmoothed=True. The default is ON because that’s what you want in 95% of cases. If you need the raw value (for logging, for example), setsmoothed=False.- New is
get_all_gpus_summary()– the idea of an aggregator tool that delivers the status of all GPUs in a single call. Exactly what an ESP32 client needs: one request every 1 to 2 seconds, all data in one shot. Saves network round trips.
Step 6: Start and test the server
Now start the server again with all of its updates.
Command: python gpu_monitor_EMA.py
You’ll see the startup message of your FastMCP server in the terminal. Now run the test to check everything still works as described above multiple times.
I want my MCP server to always run when the server boots up, so I’m setting it up as a background job as described in the next section.
Step 7 (optional): Set it up as a systemd service
If the MCP server should run permanently – which it should for me, because my ESP32-Claw should be able to query it at any time – I set up a systemd service.
Create the service file:
Command: sudo nano /etc/systemd/system/gpu-monitor-mcp.service
You’ll need to adjust the service file to match your directories and filenames. Read the description carefully and change the places that are different on your machine.
[Unit]
Description=GPU Monitor MCP Server
After=network.target

[Service]
Type=simple
User=ingmar
WorkingDirectory=/home/ingmar/gpu-monitor-mcp
ExecStart=/home/ingmar/gpu-monitor-mcp/.venv/bin/python /home/ingmar/gpu-monitor-mcp/gpu_monitor.py
Restart=on-failure
RestartSec=5

[Install]
WantedBy=multi-user.target
Adjust paths and username (ingmar) accordingly.
Activate and start:
Command: sudo systemctl daemon-reload
Command: sudo systemctl enable --now gpu-monitor-mcp
Command: sudo systemctl status gpu-monitor-mcp
If everything is configured correctly, the server now also starts automatically when the server reboots. You can check the logs with journalctl -u gpu-monitor-mcp -f in case there are any issues.
Pitfalls I want to mention here
1. nvidia-ml-py vs. pynvml – confusing names
Both libraries exist on PyPI. The official package maintained by NVIDIA is called nvidia-ml-py but is imported as pynvml. There’s also an older package called pynvml from a third party that is no longer maintained, so we don’t want to install it. If something goes wrong: uv pip uninstall pynvml nvidia-ml-py and then install only nvidia-ml-py cleanly.
2. NVML initialization fails
If pynvml.nvmlInit() throws a NVMLError_LibraryNotFound, the driver is usually not installed correctly, or the driver version doesn’t match the CUDA version. Check whether your GPU(s) are visible with the following command:
Command: nvidia-smi
If that already doesn’t work, it’s a driver issue, not a pynvml one.
3. FastMCP version and transport names
FastMCP is currently evolving fast. The label transport="sse" may be replaced by transport="streamable-http" or similar names in future versions. If you get a ValueError about transport at startup, check the current FastMCP docs.
URL: https://gofastmcp.com/getting-started/welcome
4. EMA values don’t update
On the first tool call the smoother has no previous value and simply takes the raw value as-is. That’s intentional and only becomes a nuisance if your first call happens to read an unrealistic value (e.g. because there’s no load at that moment). If you want to avoid that, you can preload the smoother with a dummy value (e.g. 0) at server start.
5. What you should NOT do
pynvml.nvmlInit()on every tool call – that costs unnecessary time and is not thread-safe.pynvml.nvmlShutdown()at the end of a tool call – that destroys the state between requests. The shutdown belongs in a server-shutdown handler, if used at all.- Exposing the server unprotected to the open internet. MCP has no built-in authentication. For LAN operation in your own workshop that’s fine, anything beyond that at minimum behind Tailscale, WireGuard, or a reverse proxy with token auth.
What’s coming next?
With this server you have the data provider. What’s still missing is the consumer. In the next posts I’ll build that out in two directions:
- NeMo Agent Toolkit as MCP client: I’ll connect the server to my NAT workflow from the last post. That way my agent can include real hardware values in its responses – for example when I ask “Are my GPUs currently free for fine-tuning?”, the agent calls the tool, sees 5% load, and clearly says yes.
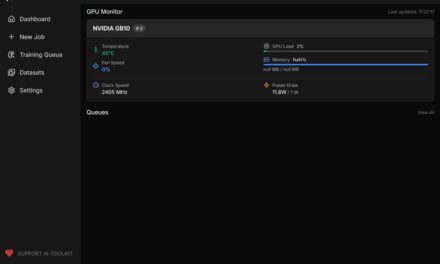
- ESP-Claw as MCP client with LED ring: That’s the actual goal of this series. My ESP32-P4 with the ESP-Claw framework has a built-in MCP client capability. A custom skill calls
get_all_gpus_summaryevery two seconds and visualizes compute utilization as a filled ring, temperature as a color gradient, and power draw as brightness.
Both are independent and exciting building blocks that I’m planning to build piece by piece in the next posts.
My personal takeaway
What surprised me most about this small project: how little code it actually takes to build a meaningful infrastructure bridge. About 100 lines of Python, a very focused library (FastMCP), and a very old, very stable NVIDIA API (NVML) – and I already have a data source that any MCP-compatible tool can tap into. From a small ESP32 microcontroller to Claude Desktop on my laptop. No cloud, no SaaS subscription, no third-party API key.
Exactly this constellation – standard protocol plus own hardware plus minimal software – is for me the practical core of what I mean by “sovereign AI”. It’s not about reinventing every piece yourself. It’s about knowing the building blocks, being able to combine them, and not taking on dependencies you don’t need.
My MCP server for the GPUs is small. But it’s mine. And that makes the difference.
Good luck building your own!


The tutorial offers a clear and practical guide for setting up and running the Tensorflow Object Detection Training Suite. Could…
This works using an very old laptop with old GPU >>> print(torch.cuda.is_available()) True >>> print(torch.version.cuda) 12.6 >>> print(torch.cuda.device_count()) 1 >>>…
Hello Valentin, I will not share anything related to my work on detecting mines or UXO's. Best regards, Maker
Hello, We are a group of students at ESILV working on a project that aim to prove the availability of…